Get full access to premium PowerPoint templates at a limited-time price.Get Now
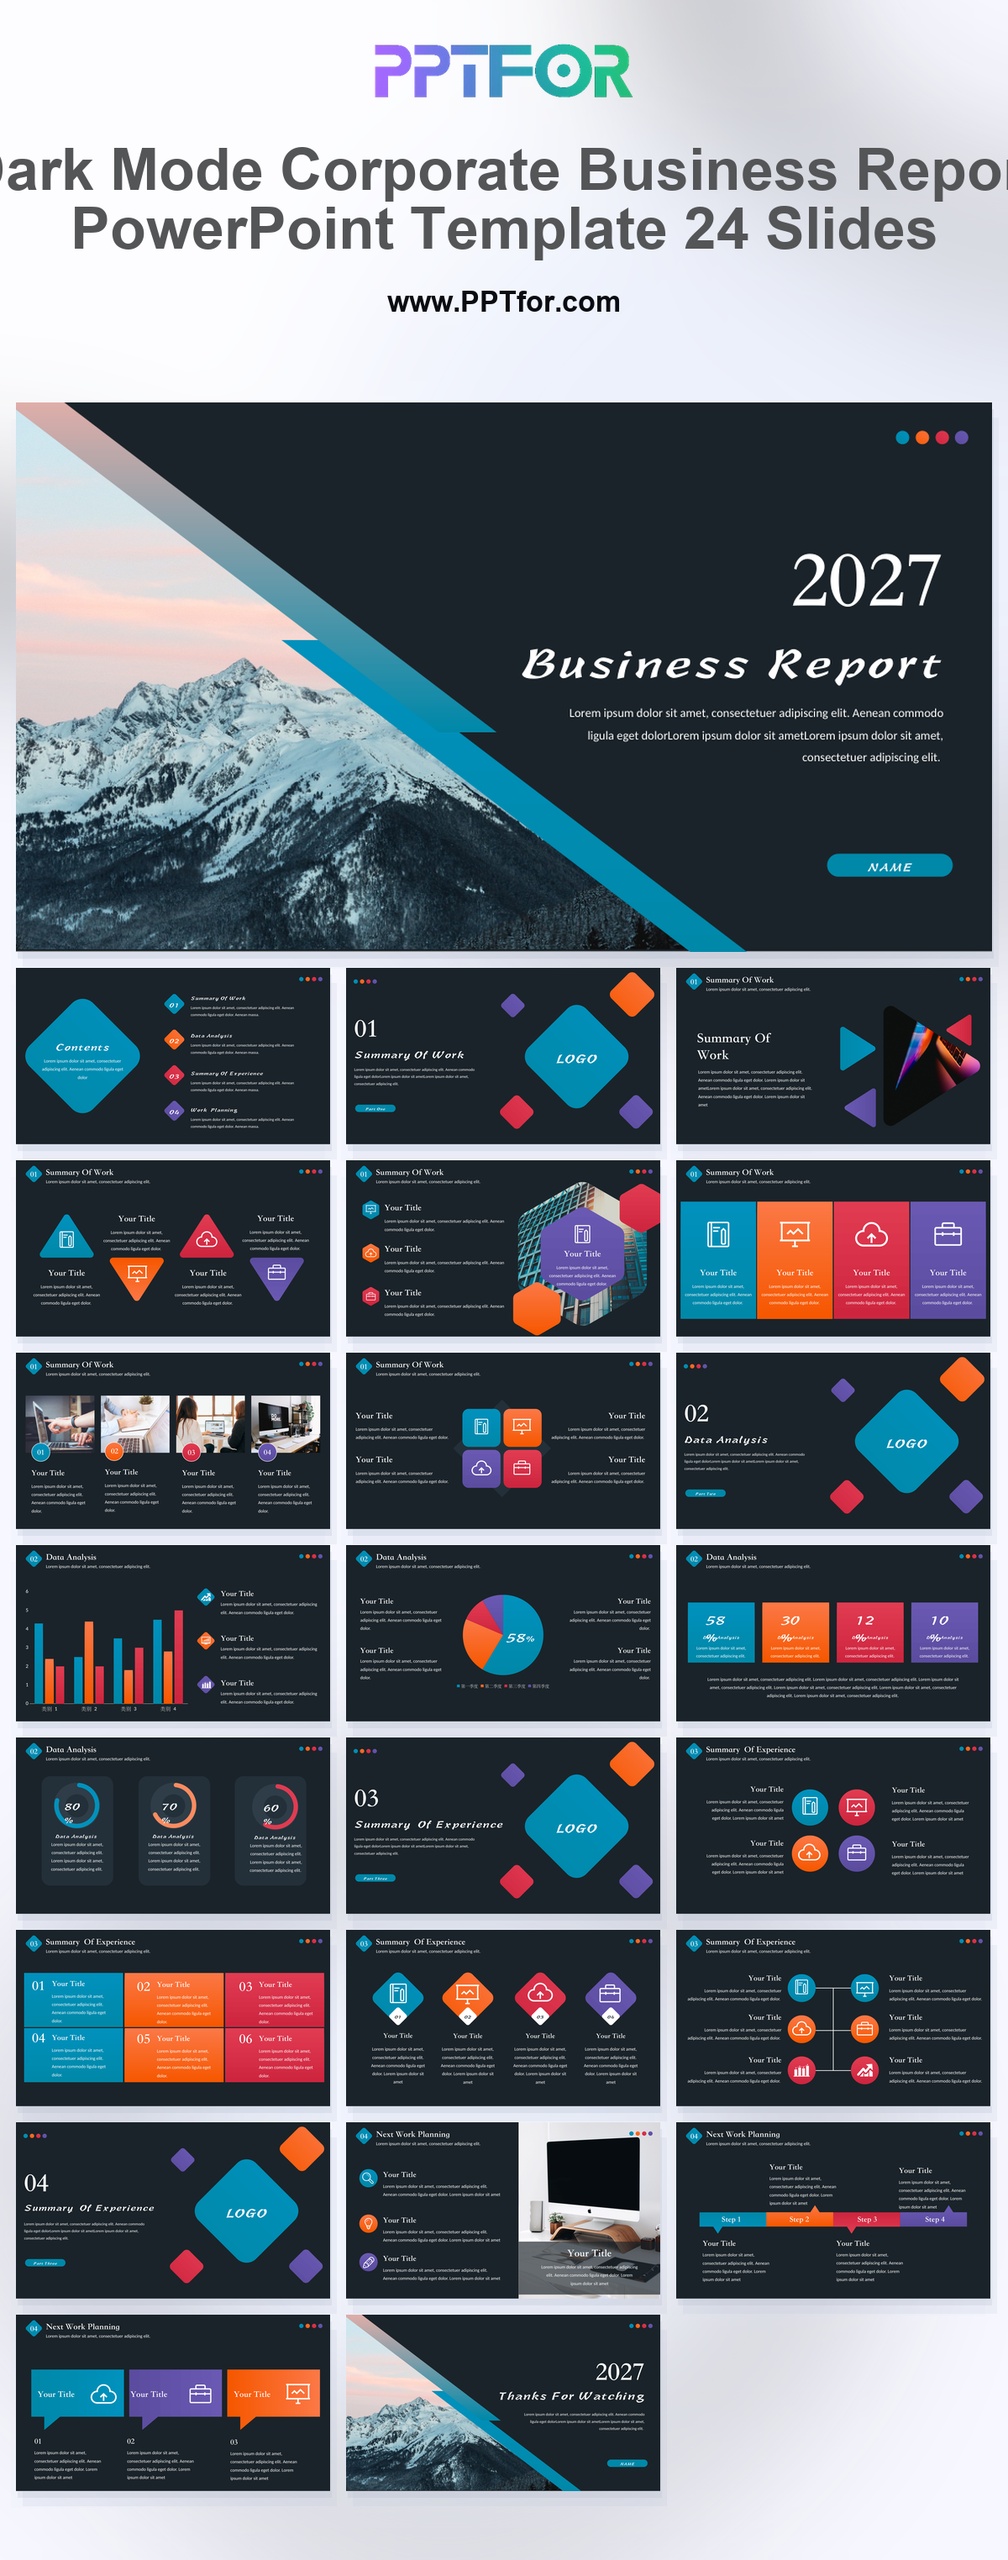
The Dark Mode Business Report PPT Template offers 24 slides for a concise results review. Work-summary layouts, charts, comparative tables, and roadmap planning support a sequence from current performance to next-period priorities.
Visual elements include high-contrast dark backgrounds, vibrant rhombus color blocks, sleek data visualization, minimalist sans-serif typography, and mountain landscape imagery.
Choose this compact dark report for a screen-based team or management update. Check chart labels on the display used for the meeting, especially when showing several series or small percentage values.
Prepare the reporting period, actual results, comparison figures, and the main decisions. Keep the work summary factual and assign an owner and date to each next-period action.
The deck includes a business report cover, contents list, section transitions, work summary, bar, pie, and circular charts, team profiles, comparative tables, hexagonal feature grids, desktop mockup, roadmap planning, and closing slides.
Edit the text, colors, and slide elements to match your presentation. Before updating a graphic, check whether it is a native chart, a grouped shape, or an image; the editing method differs.

Get full access to our entire collection of premium PPT templates for one simple price.
Forget about complex tools or technical skills—just choose, edit, and download.