 Get full access to premium PowerPoint templates at a limited-time price.Get Now
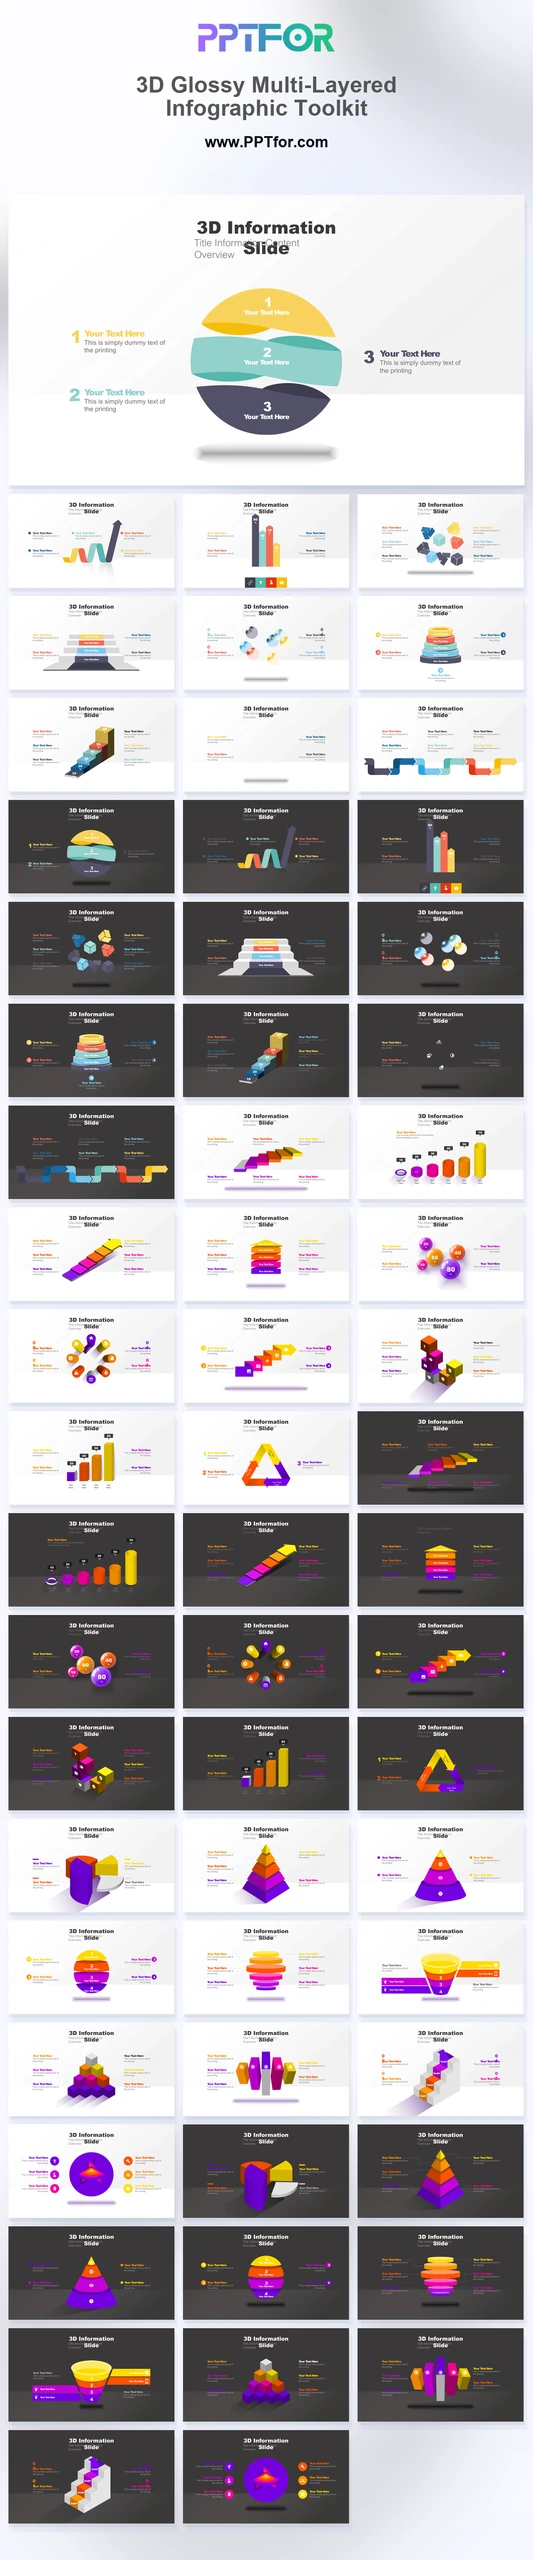
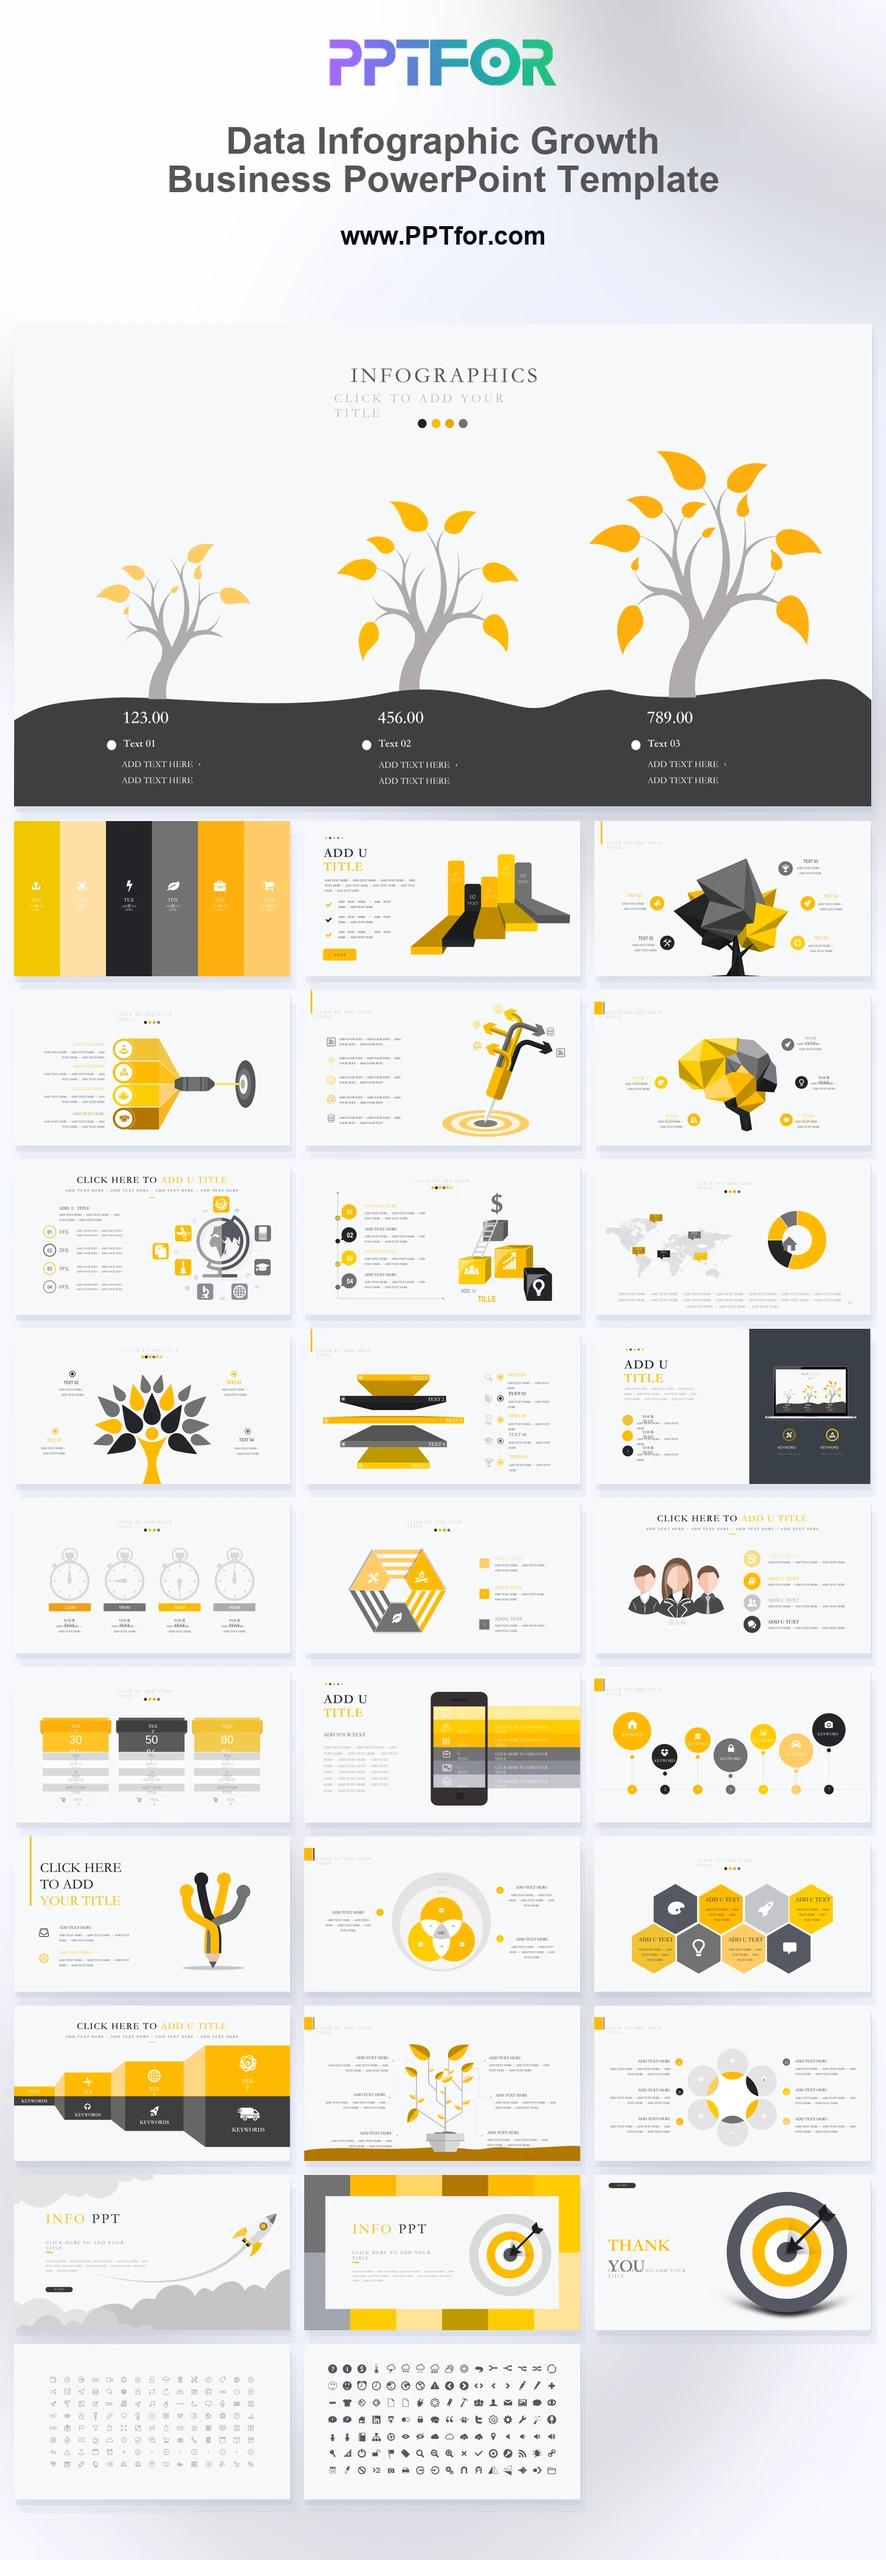
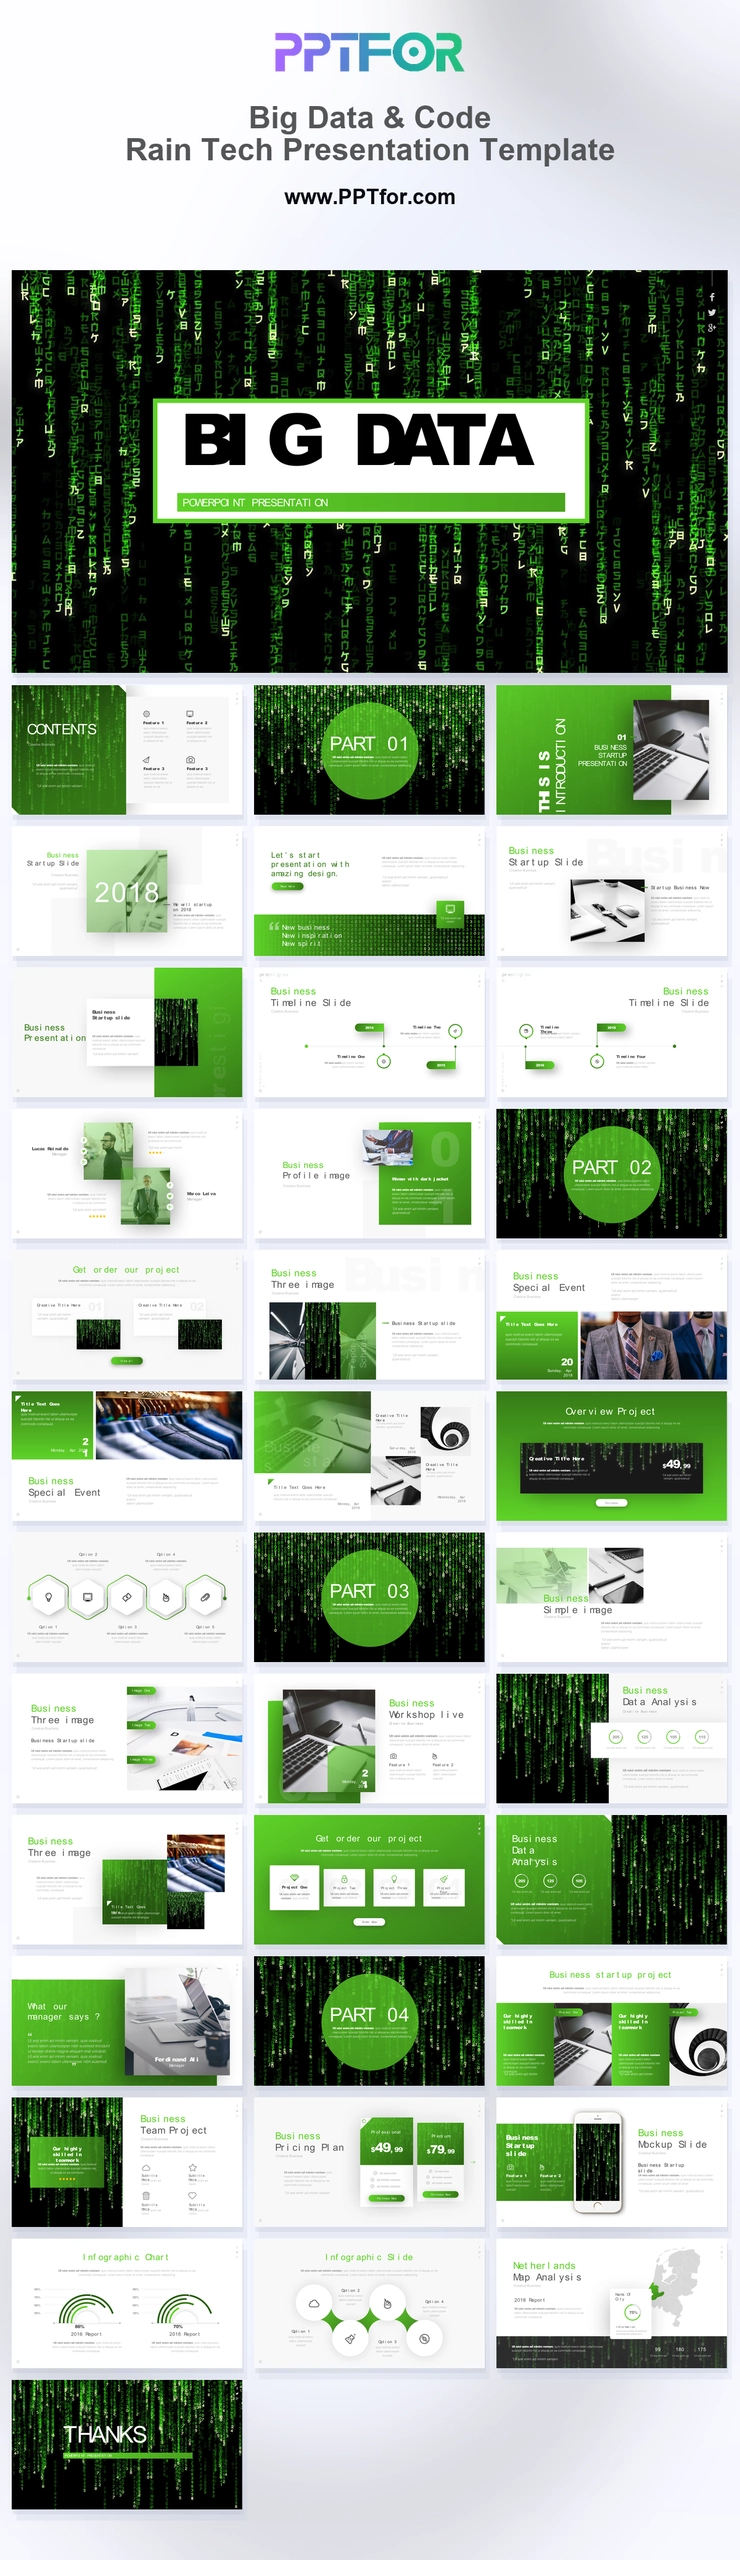
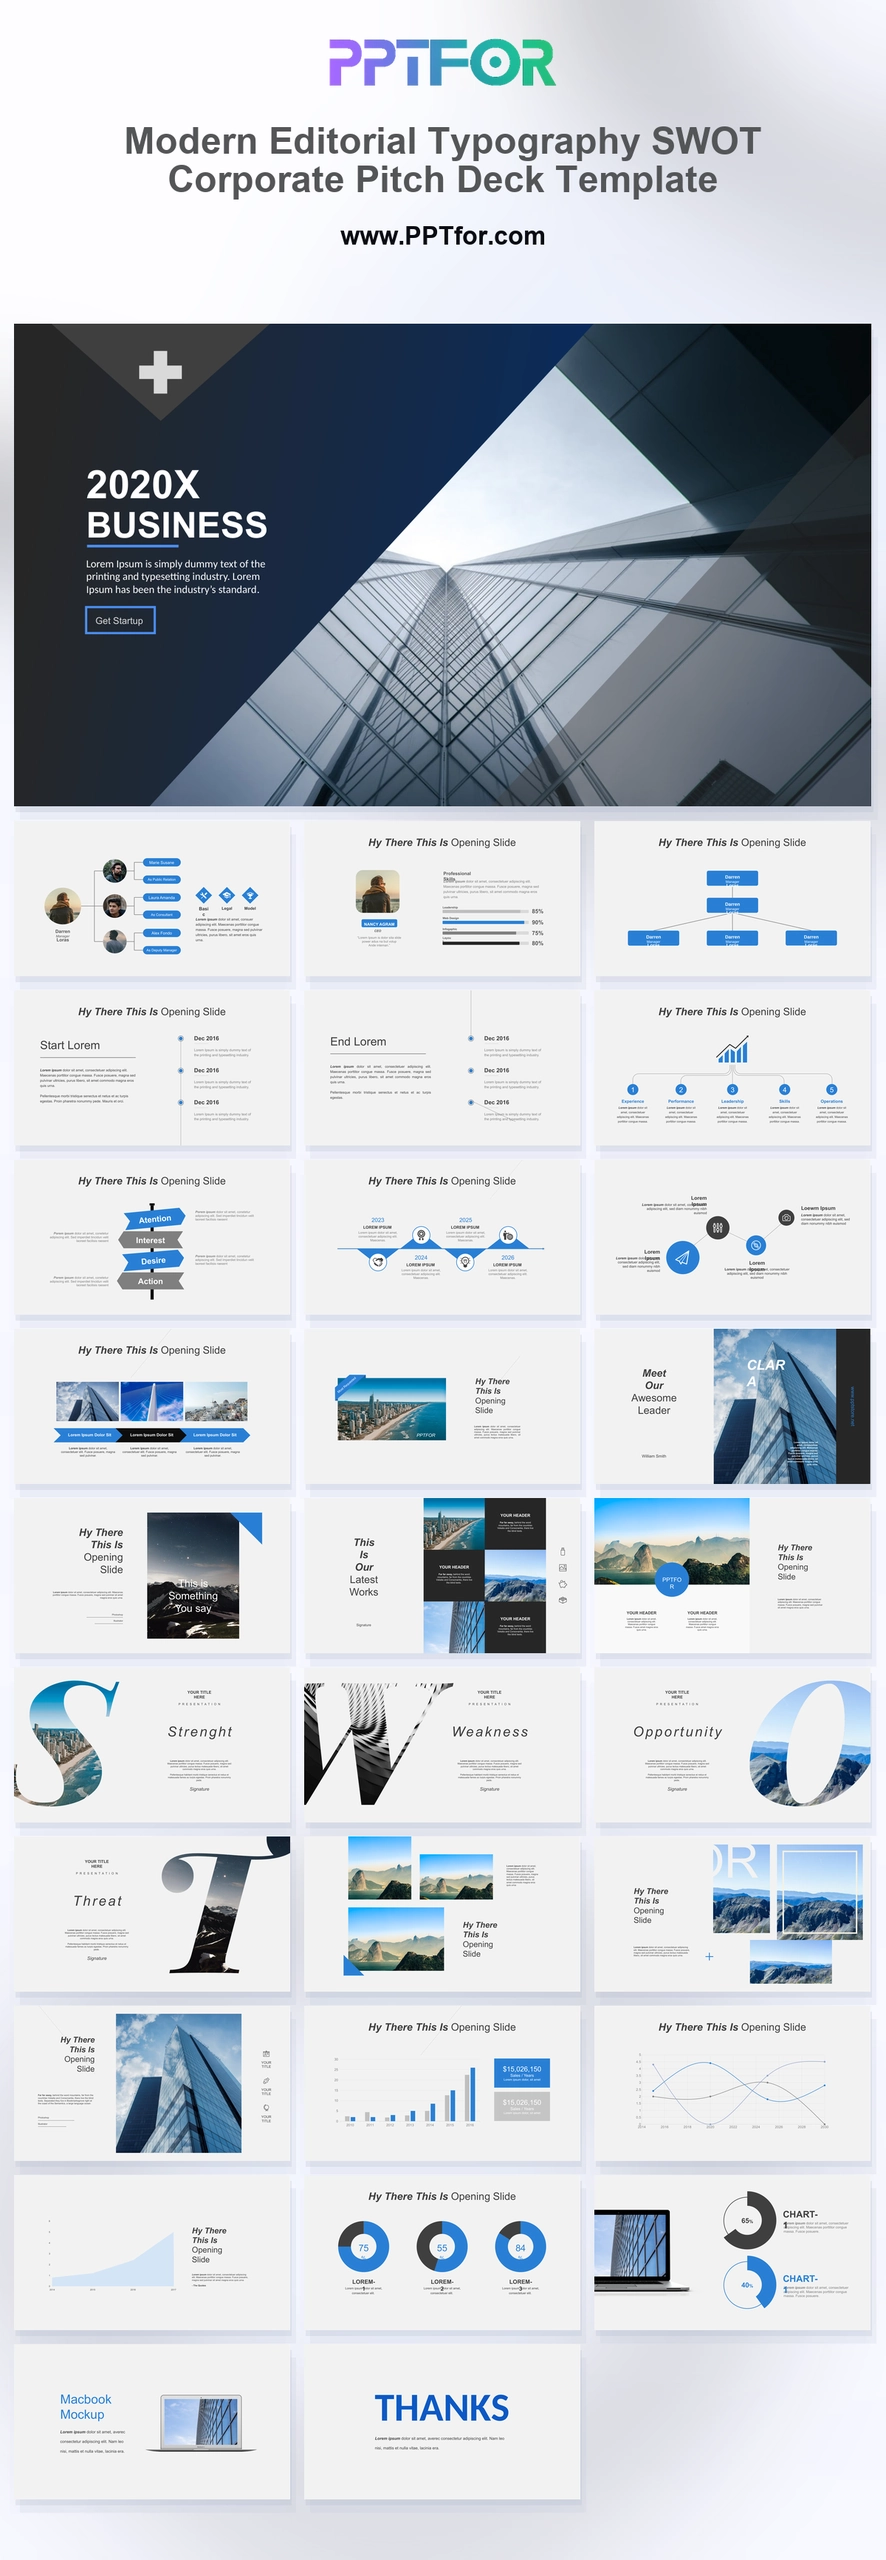
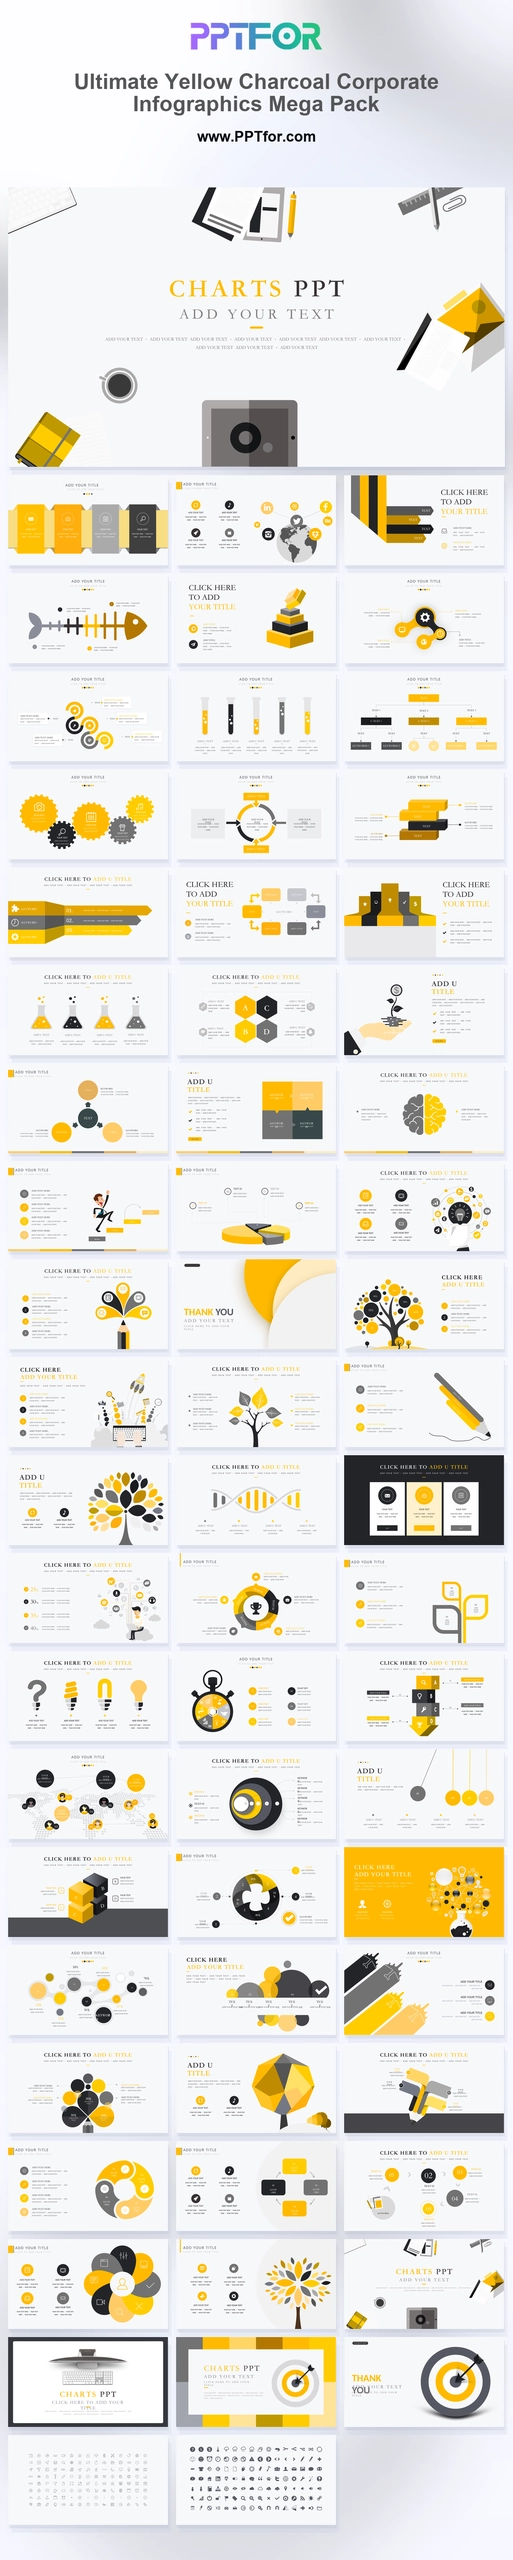
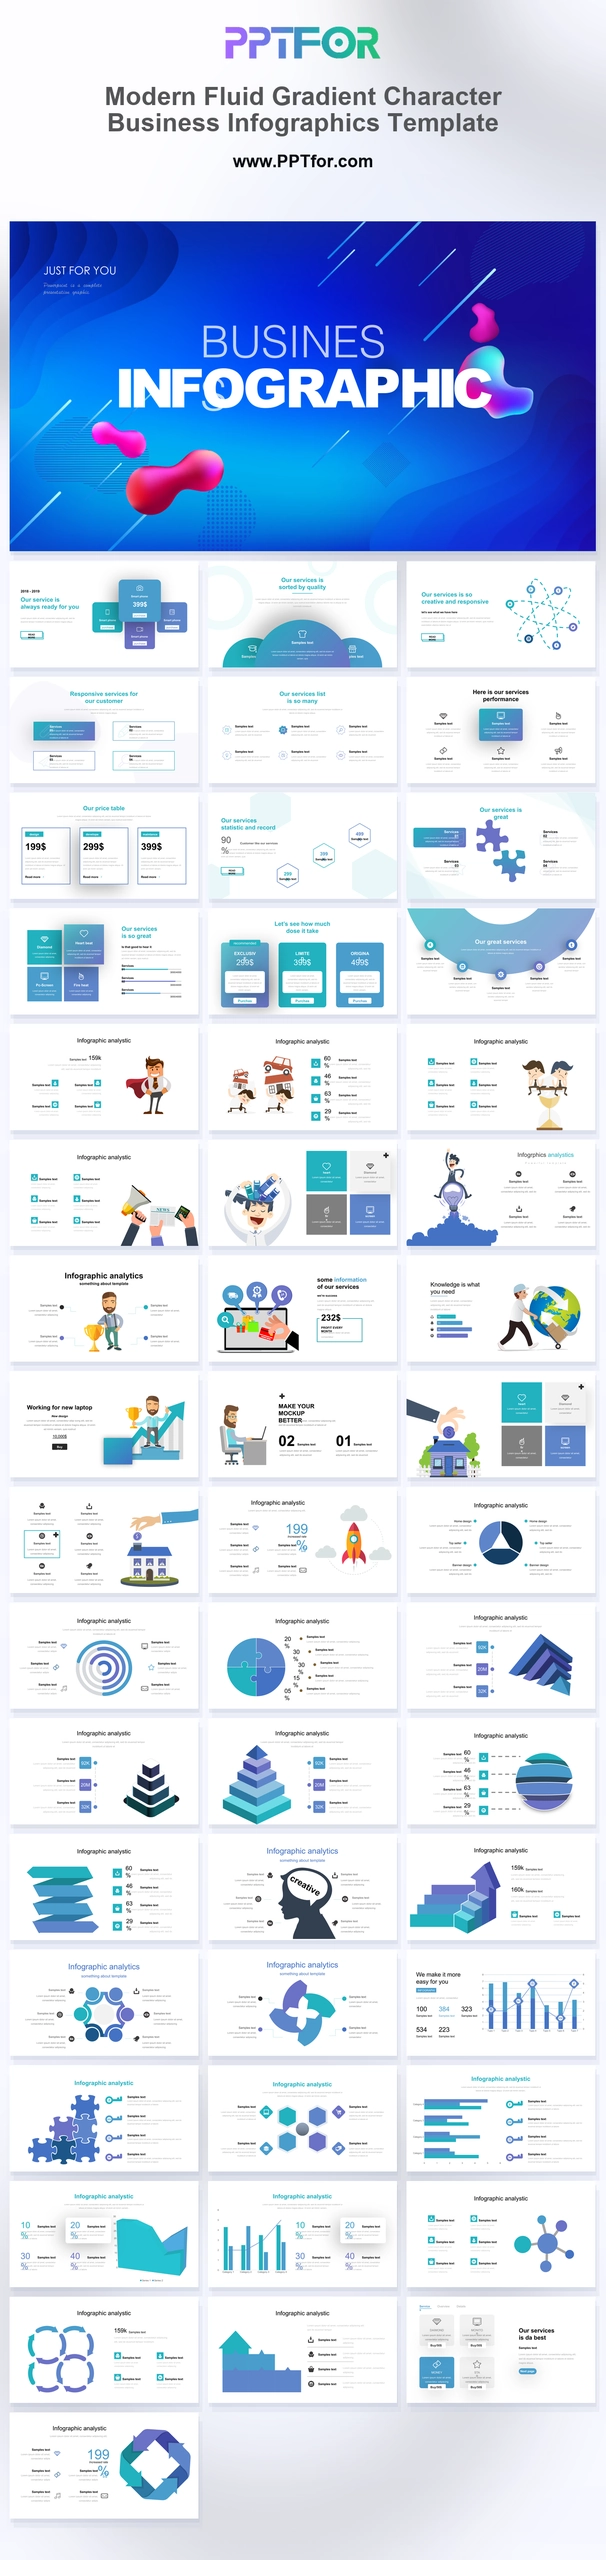
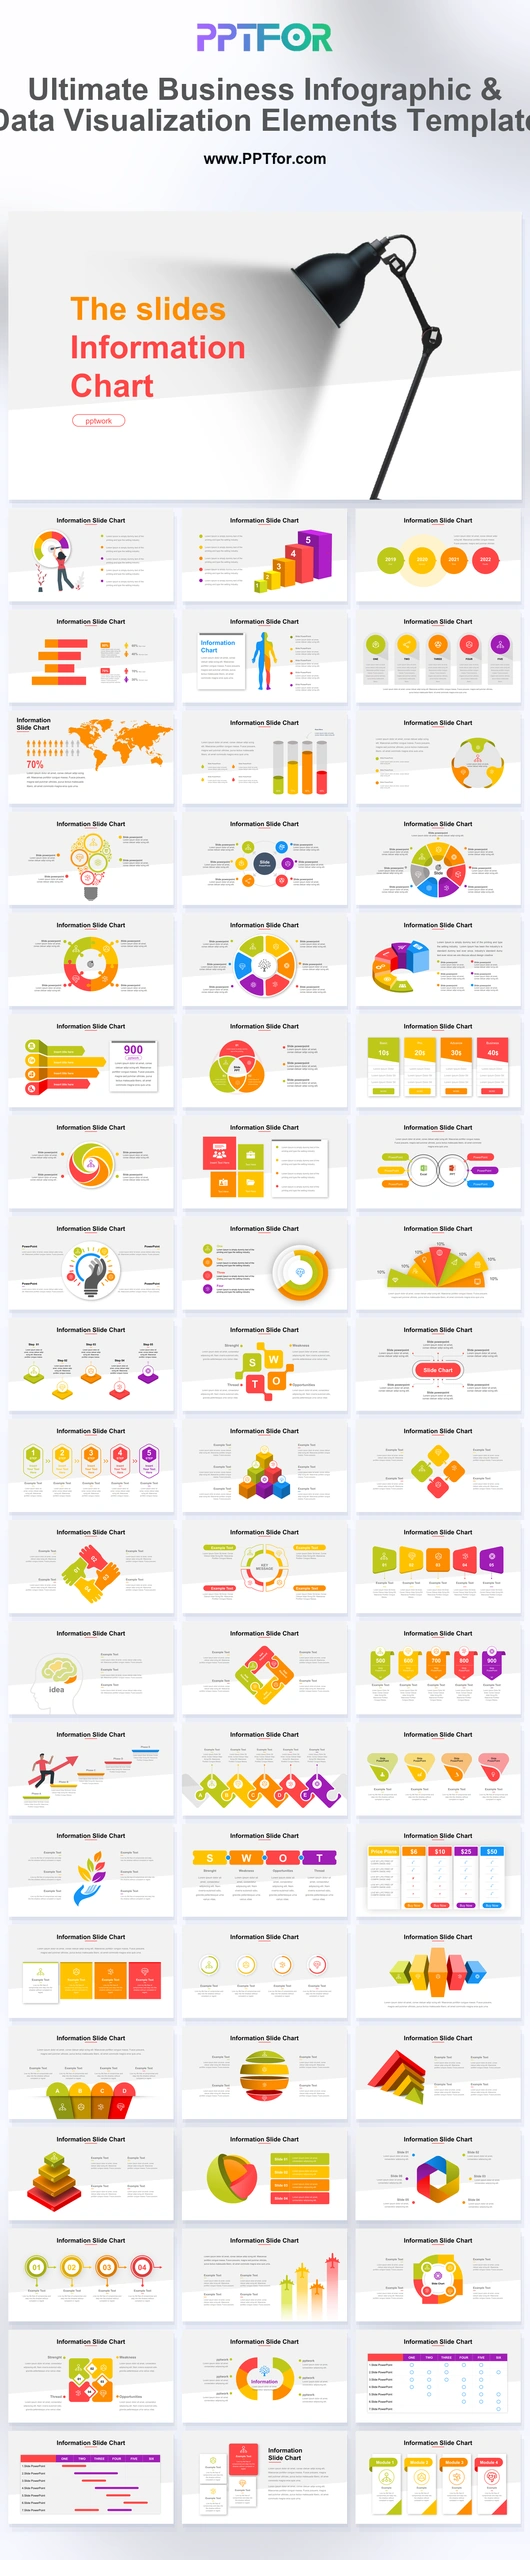
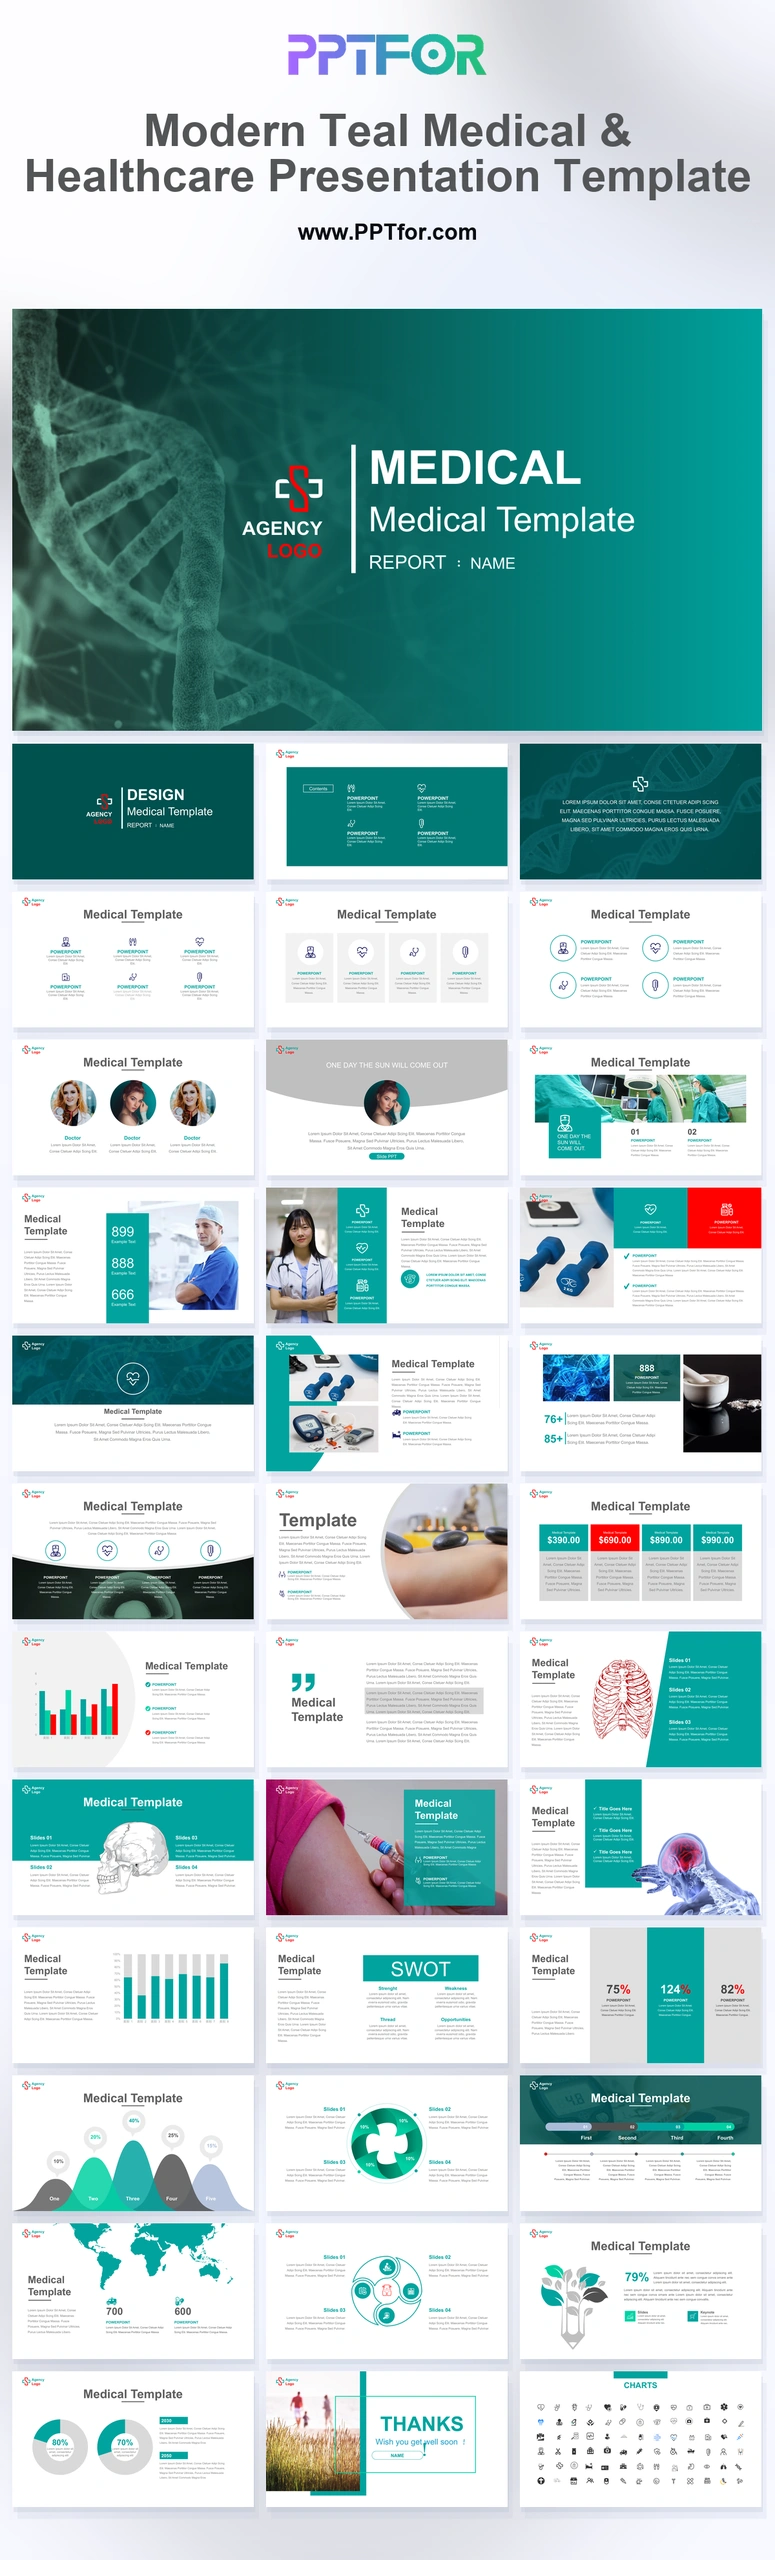
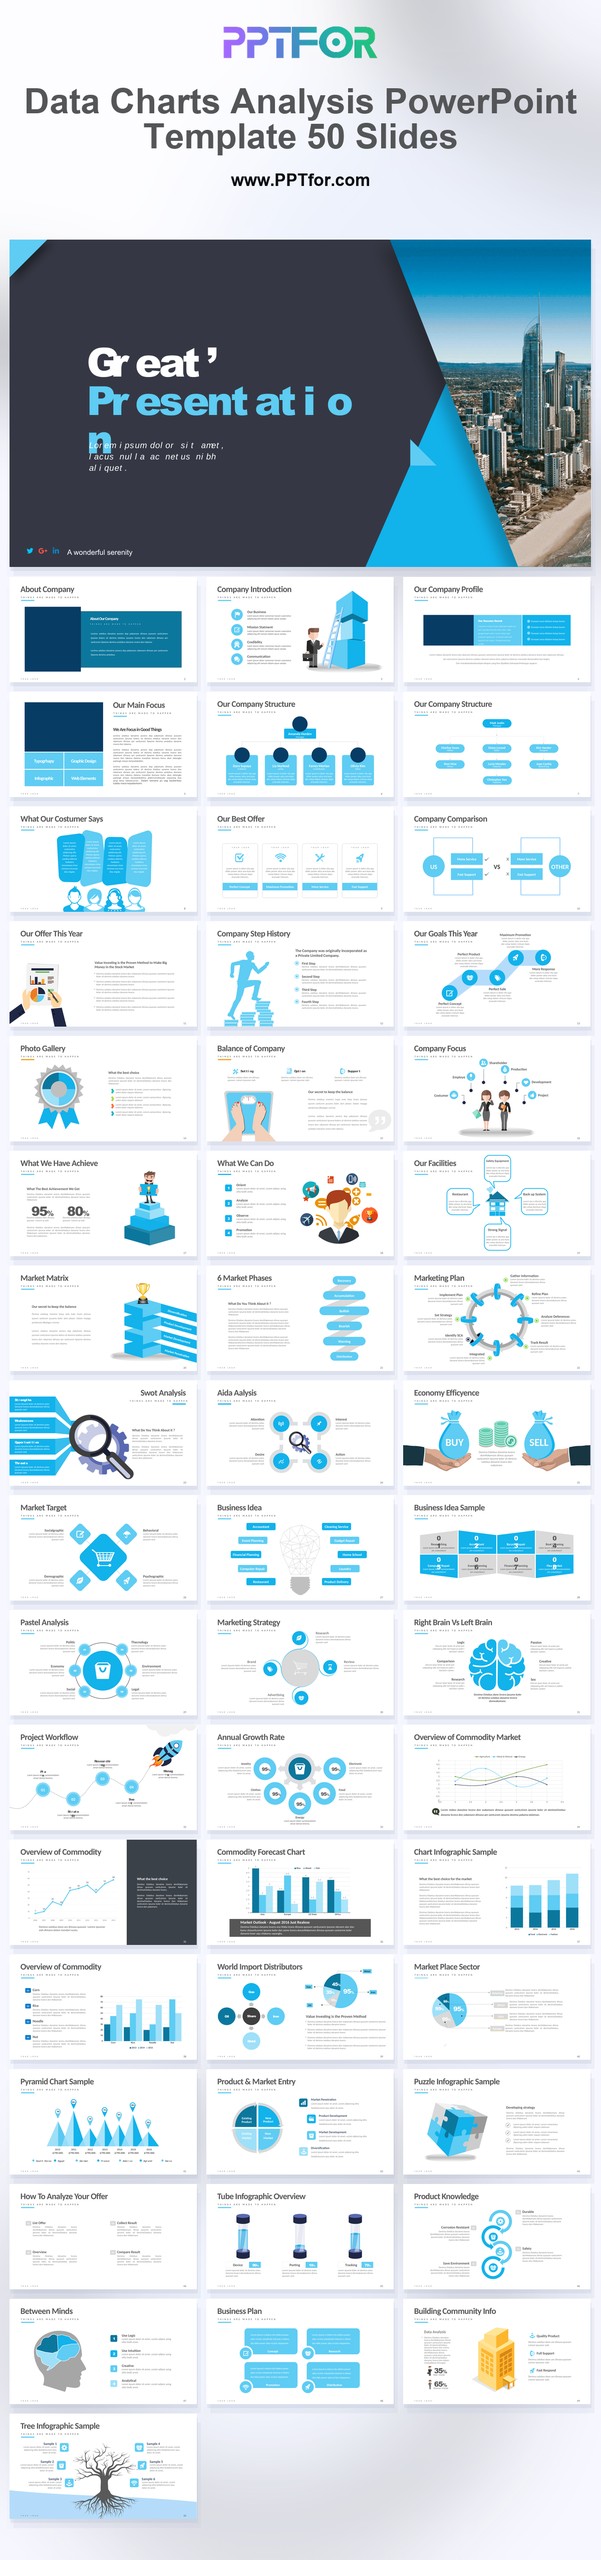
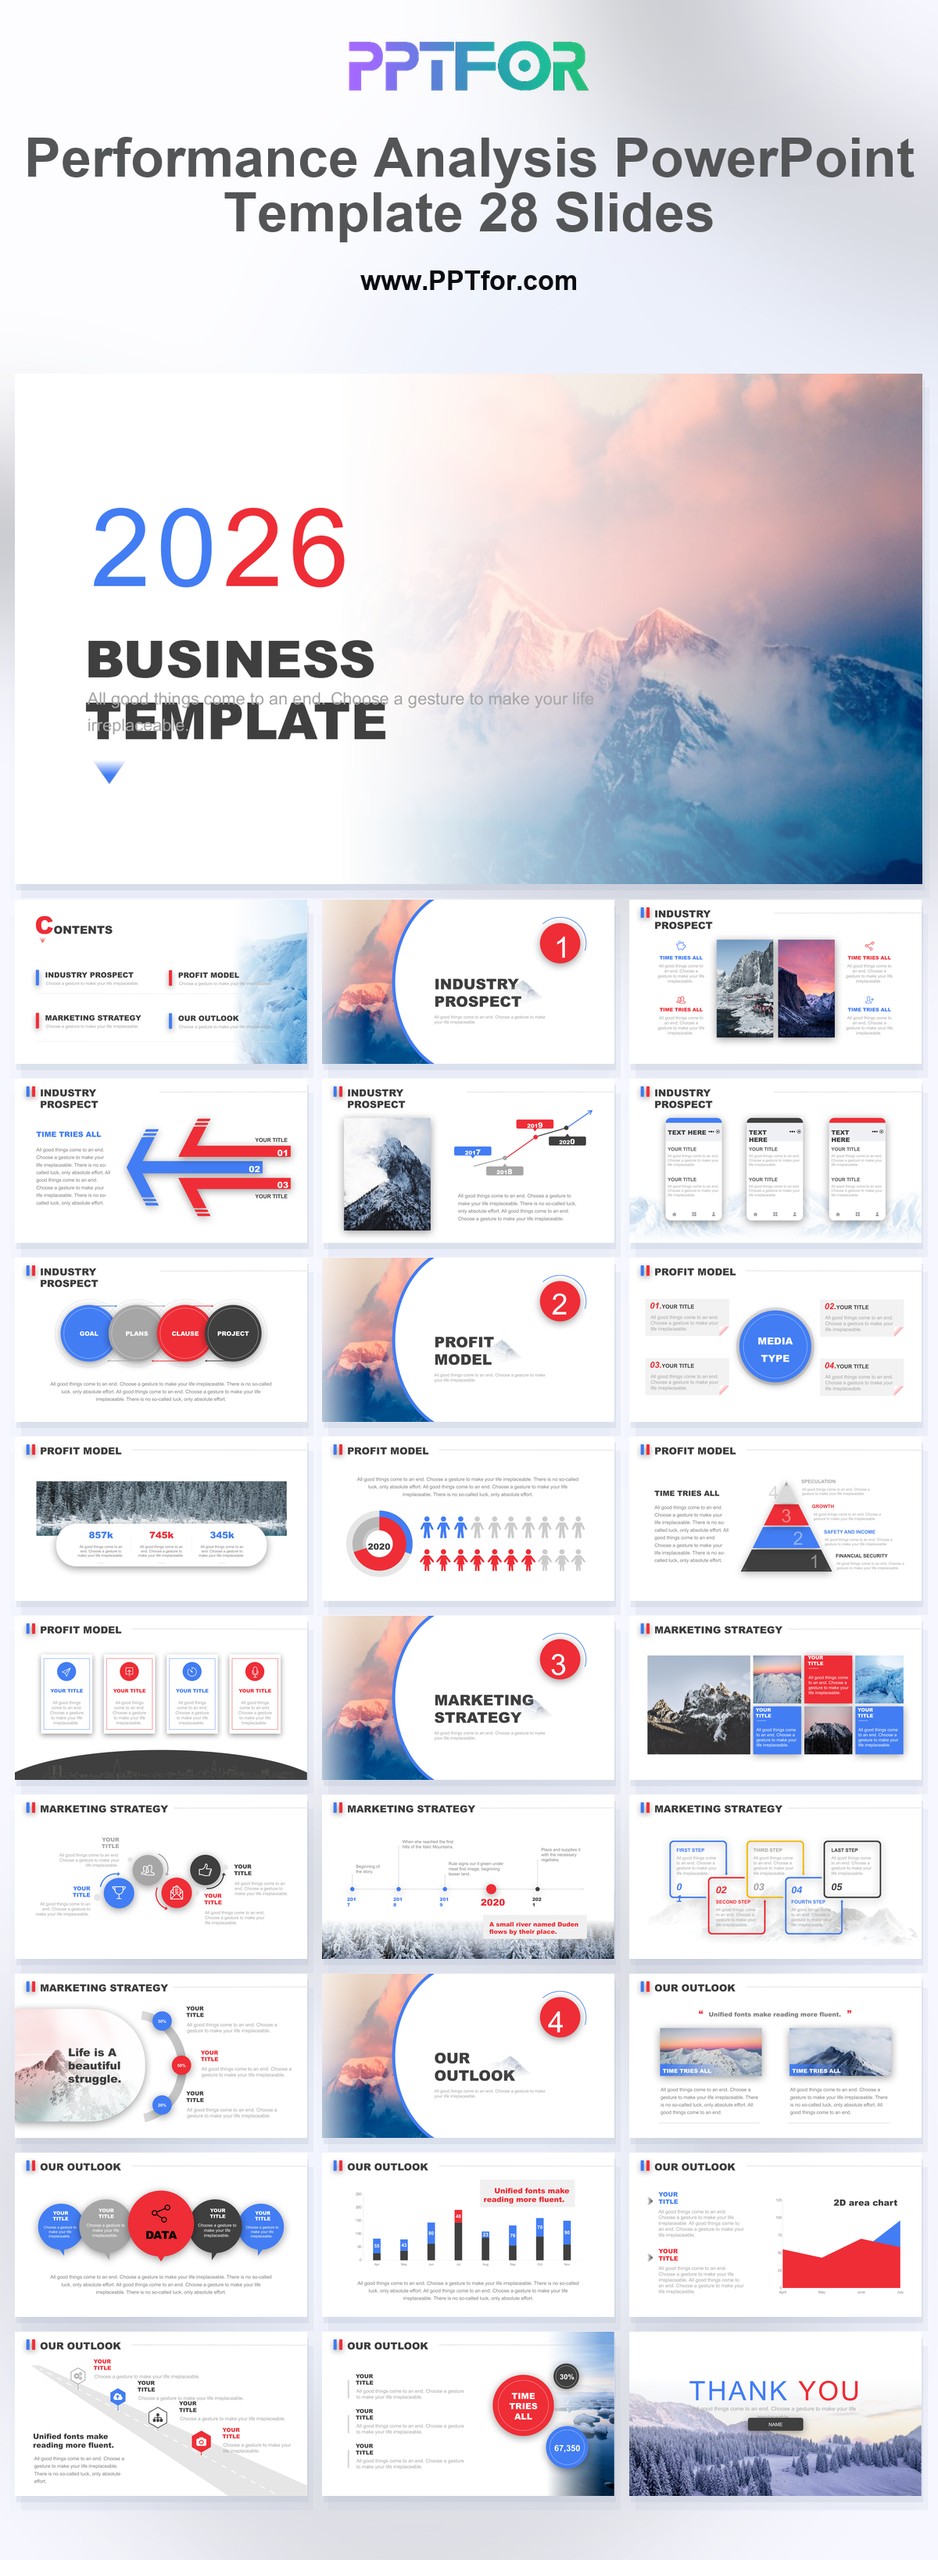
Data & Analytics Reports PowerPoint templates help teams turn metrics, reporting cycles, and business findings into presentations that are easier for executives, clients, and stakeholders to understand. This category brings together editable report deck designs for KPI reviews, dashboard summaries, performance reporting, market analysis, business insights, and data-driven presentations where structure and readability matter.
Many templates in this collection commonly support Microsoft PowerPoint, Google Slides, and Apple Keynote, which makes them practical for analysts, marketers, consultants, finance teams, and operations leaders working across different presentation workflows. The category is especially useful when executive summaries, trend analysis, reporting commentary, and performance indicators all need to sit inside one coherent presentation. Explore these Data & Analytics Reports templates to find a stronger format for your next reporting, dashboard, or business insights deck.
They are commonly used for KPI reviews, dashboard presentations, business reporting, market analysis, trend summaries, and data-driven insights that need a clearer slide structure.
Yes. This category works well for presentations that need to explain metrics, reporting periods, growth movement, operational results, and performance indicators in a more organized format.
Yes. Slides are fully editable, which makes it easier to replace sample numbers, update labels, adapt chart areas, and tailor the presentation to your own reporting context.
Yes. Many templates in this category are flexible enough for business reviews, marketing analysis, sales reporting, financial summaries, and other presentations built around measurable results.
Yes. Data & Analytics Reports templates help teams turn complex reporting into a more readable executive summary that supports stakeholder communication and faster discussion around key findings.
No. The layouts already provide a structured reporting format, so users can spend more time refining the analysis and less time building every slide from the ground up.
Many templates in this category commonly support Microsoft PowerPoint, Google Slides, and Apple Keynote, which makes it easier to edit and present reports across different teams and platforms.
They save time by giving teams a ready-made structure for dashboards, metrics, and reporting flow, which reduces formatting work and helps insights reach decision-makers in a cleaner presentation format.
Get full access to our entire collection of premium PPT templates for one simple price.
Forget about complex tools or technical skills—just choose, edit, and download.