Avatar

Fluid Gradient Business Infographics Template

by PPTFOR Editorial Team in Data & Analytics Reports

Fluid Gradient Business Infographics Template

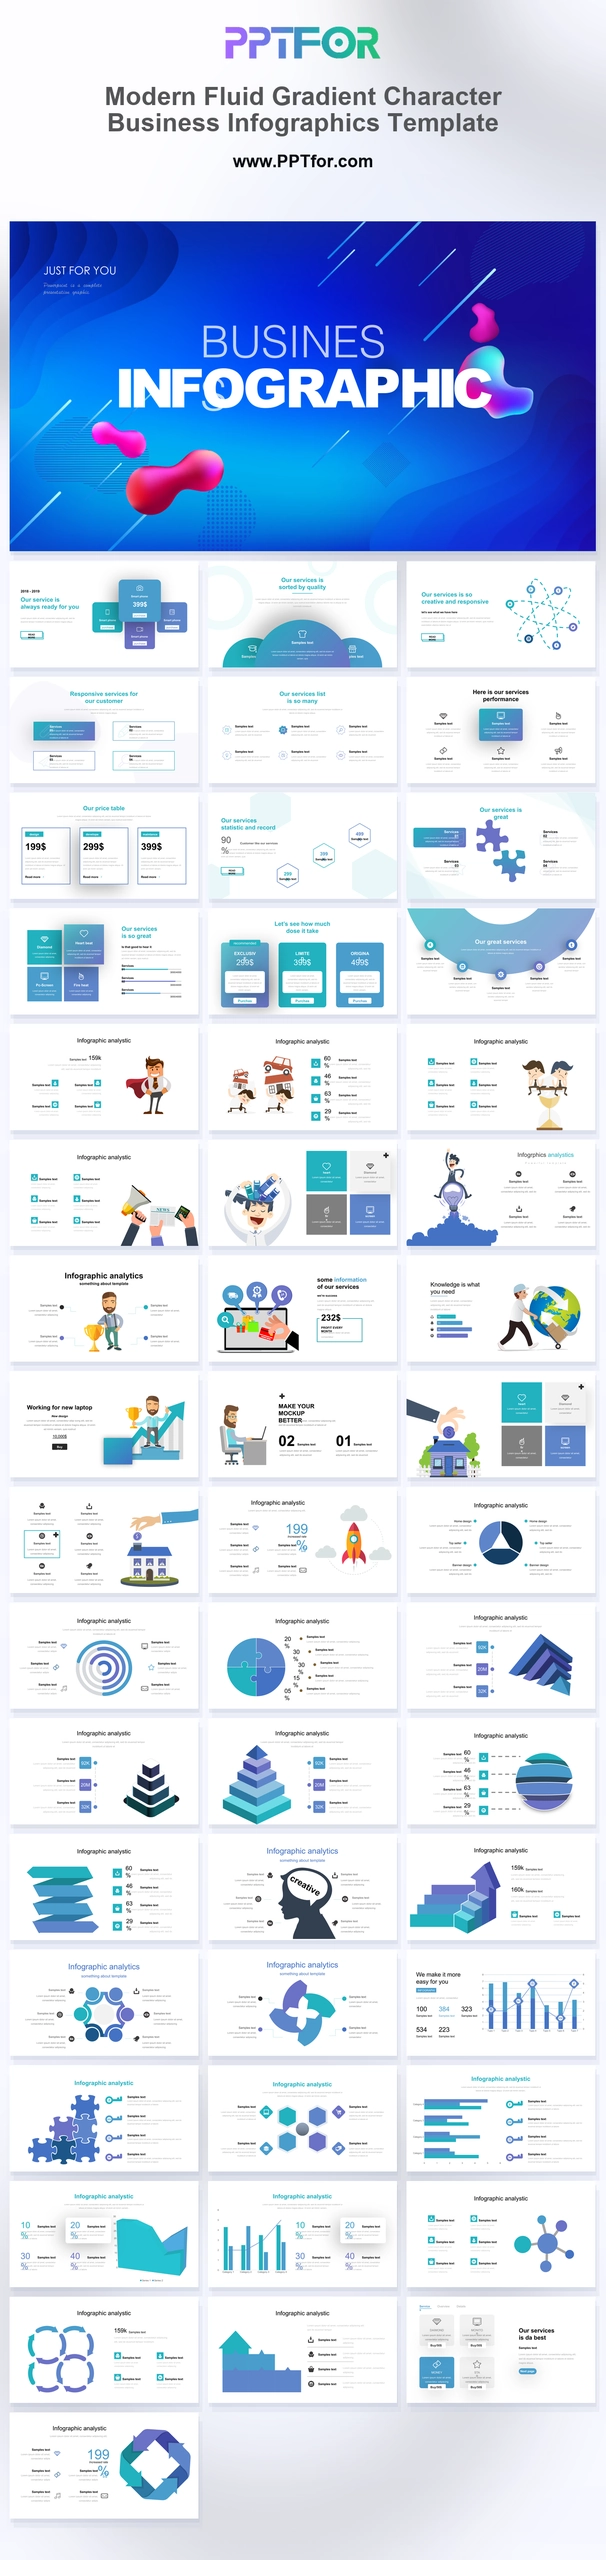
The Fluid Gradient Business Infographics Template offers 48 slides for process and performance presentations. Feature cards, connectivity matrices, milestone graphics, pyramids, and loops provide options for explaining a proposal or operational review.

Visual elements include liquid gradient blobs, diagonal accent lines, vector business characters, puzzle-driven team mechanics, 3D stacked pyramids, gear cognitive silhouettes, and rocket launch timelines.

  • Compatibility: Microsoft PowerPoint. Check fonts, charts, and image placement after importing into Google Slides or Keynote.
  • Aspect Ratio: 16:9 widescreen
  • Graphics: Editable vector graphics
  • Placeholders: Drag-and-Drop Placeholders
  • Editability: Editable text, colors, fonts, and layouts
  • Slide Count: 48 slides

Suggested Uses and Presentation Tasks

  • Marketing managers rolling out digital strategy – use feature cards, growth bar charts, and workflow visuals to present campaign direction with clearer structure.
  • Startup founders building venture pitch decks – connect product ideas, milestones, team mechanics, and launch timelines in a more engaging investor story.
  • Agency owners presenting corporate capability profiles – combine pricing grids, service logic, and character-led collaboration slides to show client value.
  • Creative producers shaping brand proposals – pair fluid gradient visuals with conceptual infographic layouts for a memorable creative pitch flow.
  • Strategy consultants mapping workflow logic – turn staircase workflows, circular loops, and connectivity matrices into easier stakeholder decision slides.
  • HR talent teams explaining collaboration models – use puzzle-driven mechanics, team illustrations, and milestone trophies to present people development plans.
  • Tech consultancies presenting operational systems – use molecular nodes, cognitive analysis slides, and data visualization matrices to explain complex business processes.

Frequently Asked Questions

When should I choose this template?

Choose this pack when the presentation needs expressive infographic layouts that can also be used individually. Keep decorative gradients separate from the encoding of values in a chart.

What should I prepare before editing?

Prepare the process stages, categories, milestone dates, and source figures. Decide which relationships are sequences, comparisons, or dependencies before selecting the corresponding layouts.

What infographic layouts are included in this 48-slide deck?

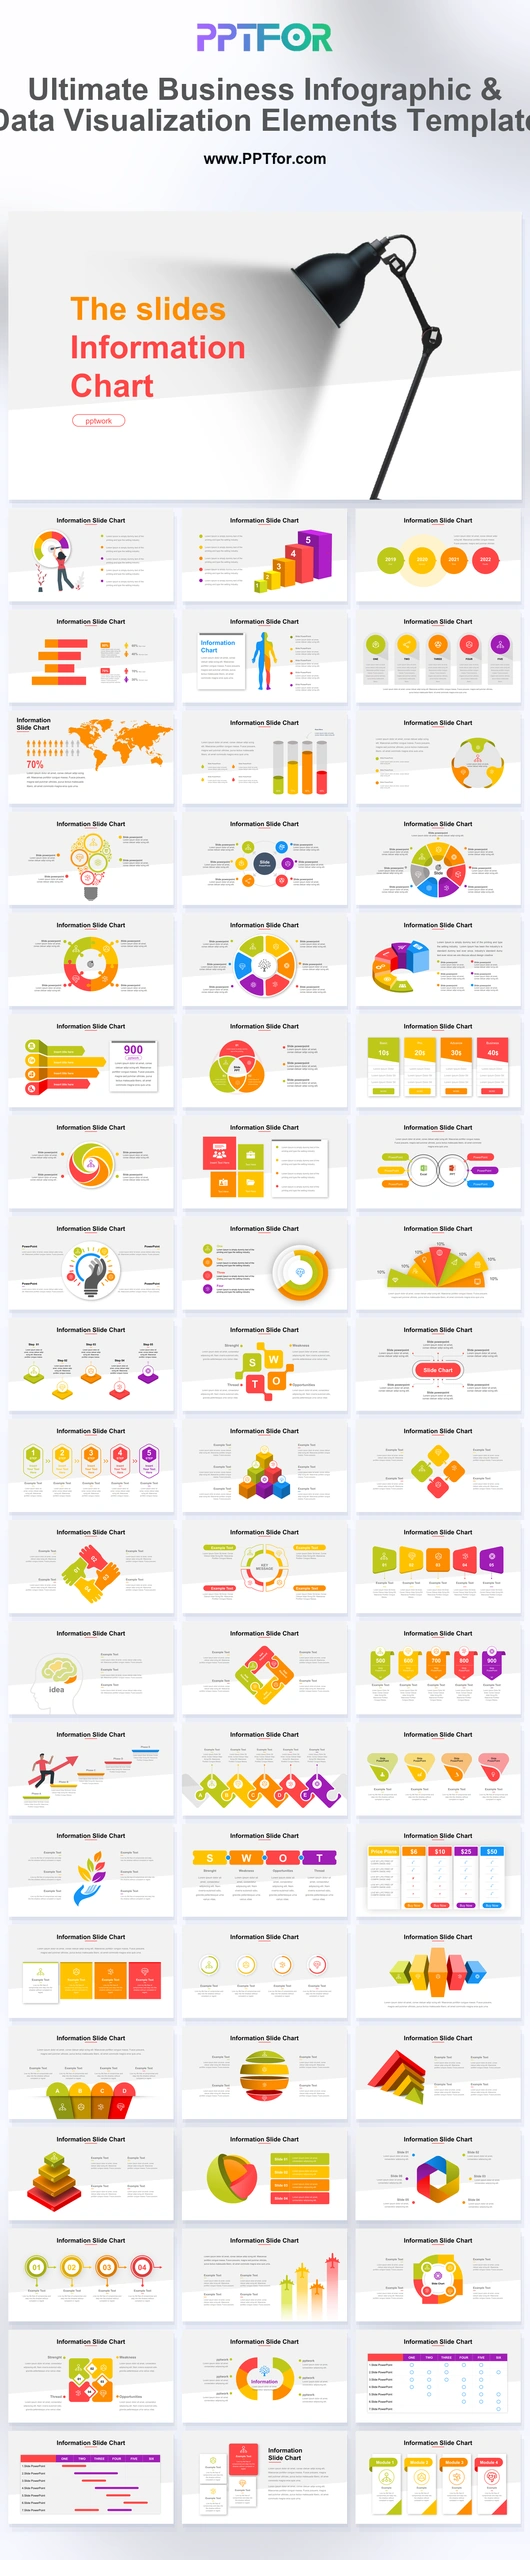
The deck includes a fluid neon title cover, feature cards, molecular nodes, pricing grids, puzzle connectivity matrices, team collaboration slides, trophy milestones, goal steps, rocket timelines, stacked pyramids, cognitive analysis, workflow staircases, circular loops, growth charts, and a closing layout.

How can I edit the template?

Edit the text, colors, and slide elements to match your presentation. Before updating a graphic, check whether it is a native chart, a grouped shape, or an image; the editing method differs.



Post a Comment

$15

$

  • Price is in US dollars and excludes tax
  • Size:16x9
  • Microsoft PowerPoint, Google Slides, Apple Keynote, PowerPoint for Mac / Office 365, WPS Office
  • 100% editable
  • What you see is what you get
  • This is a secure SSL encrypted payment. Credit Card Certificate

Get all products for only $29!

Get full access to our entire collection of premium PPT templates for one simple price.
Forget about complex tools or technical skills—just choose, edit, and download.