 Get full access to premium PowerPoint templates at a limited-time price.Get Now
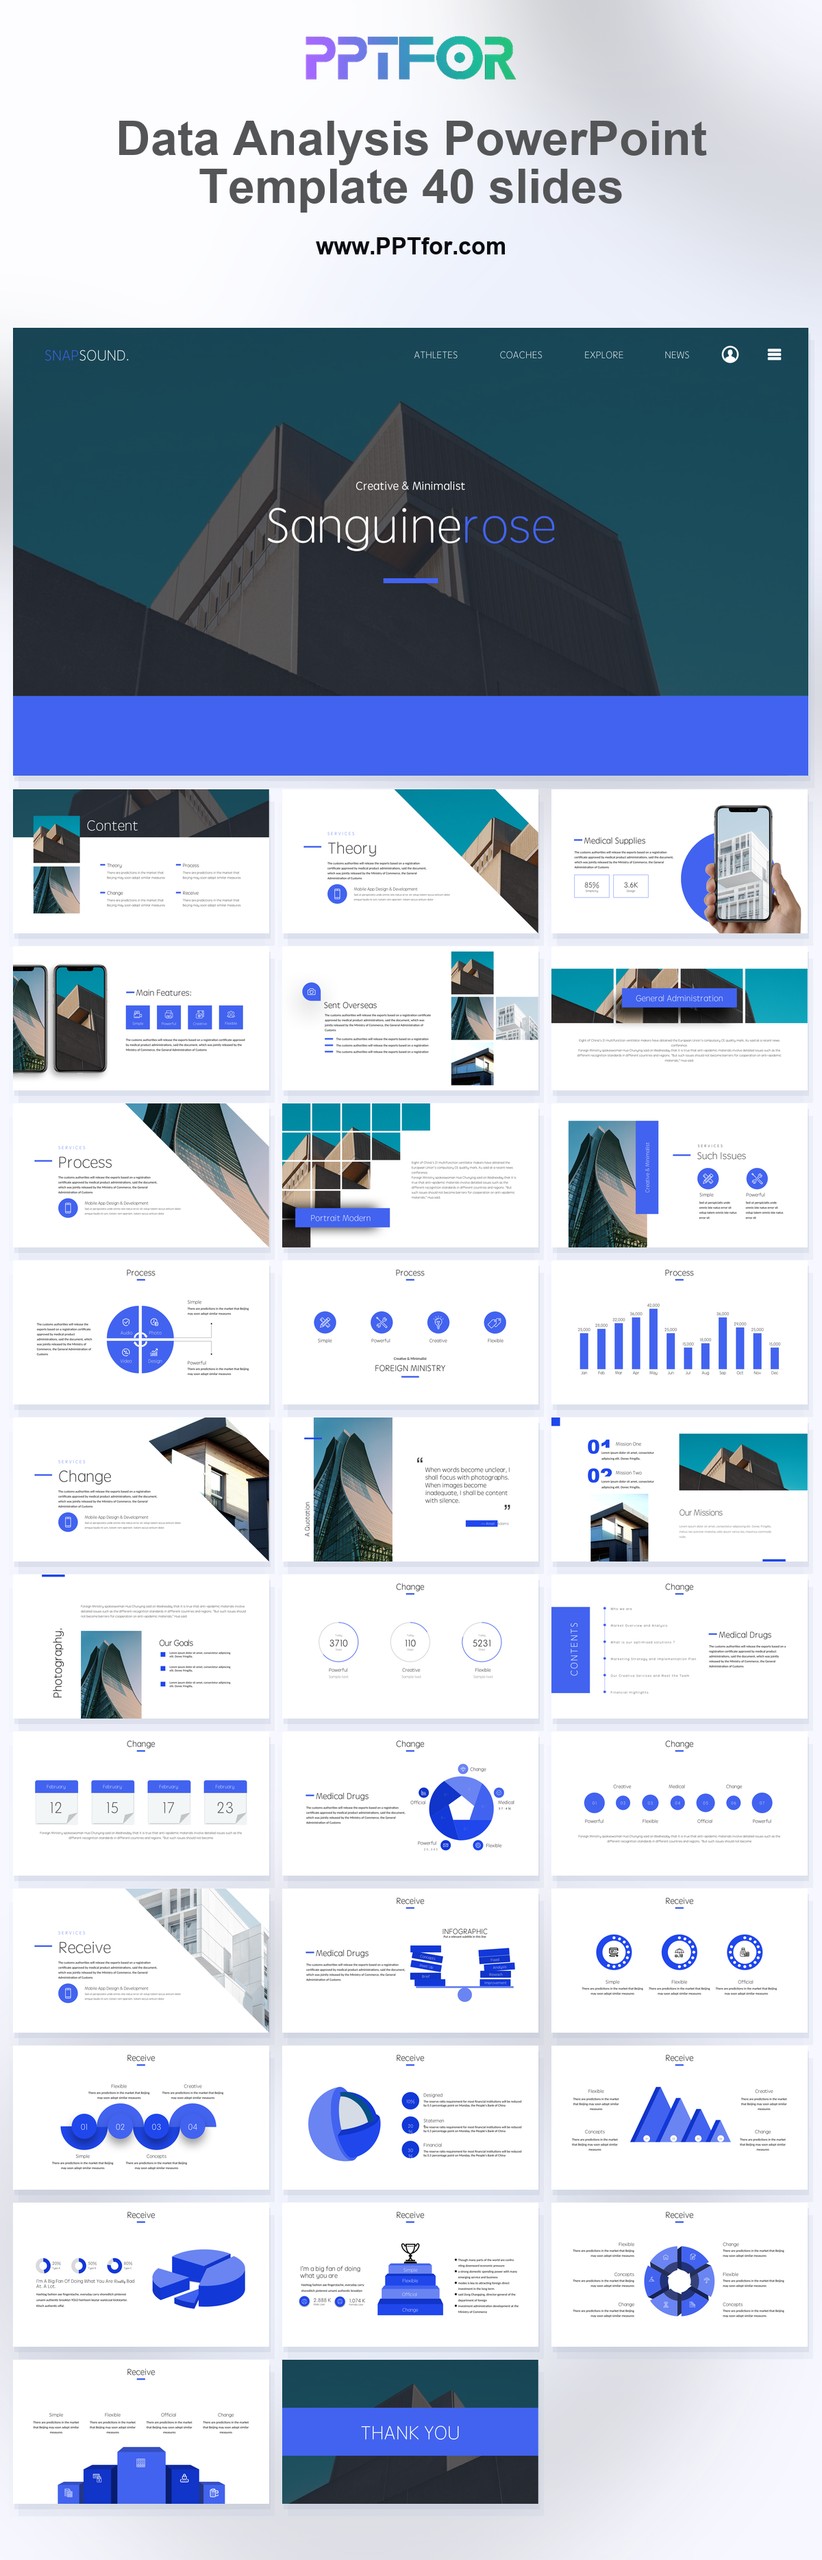
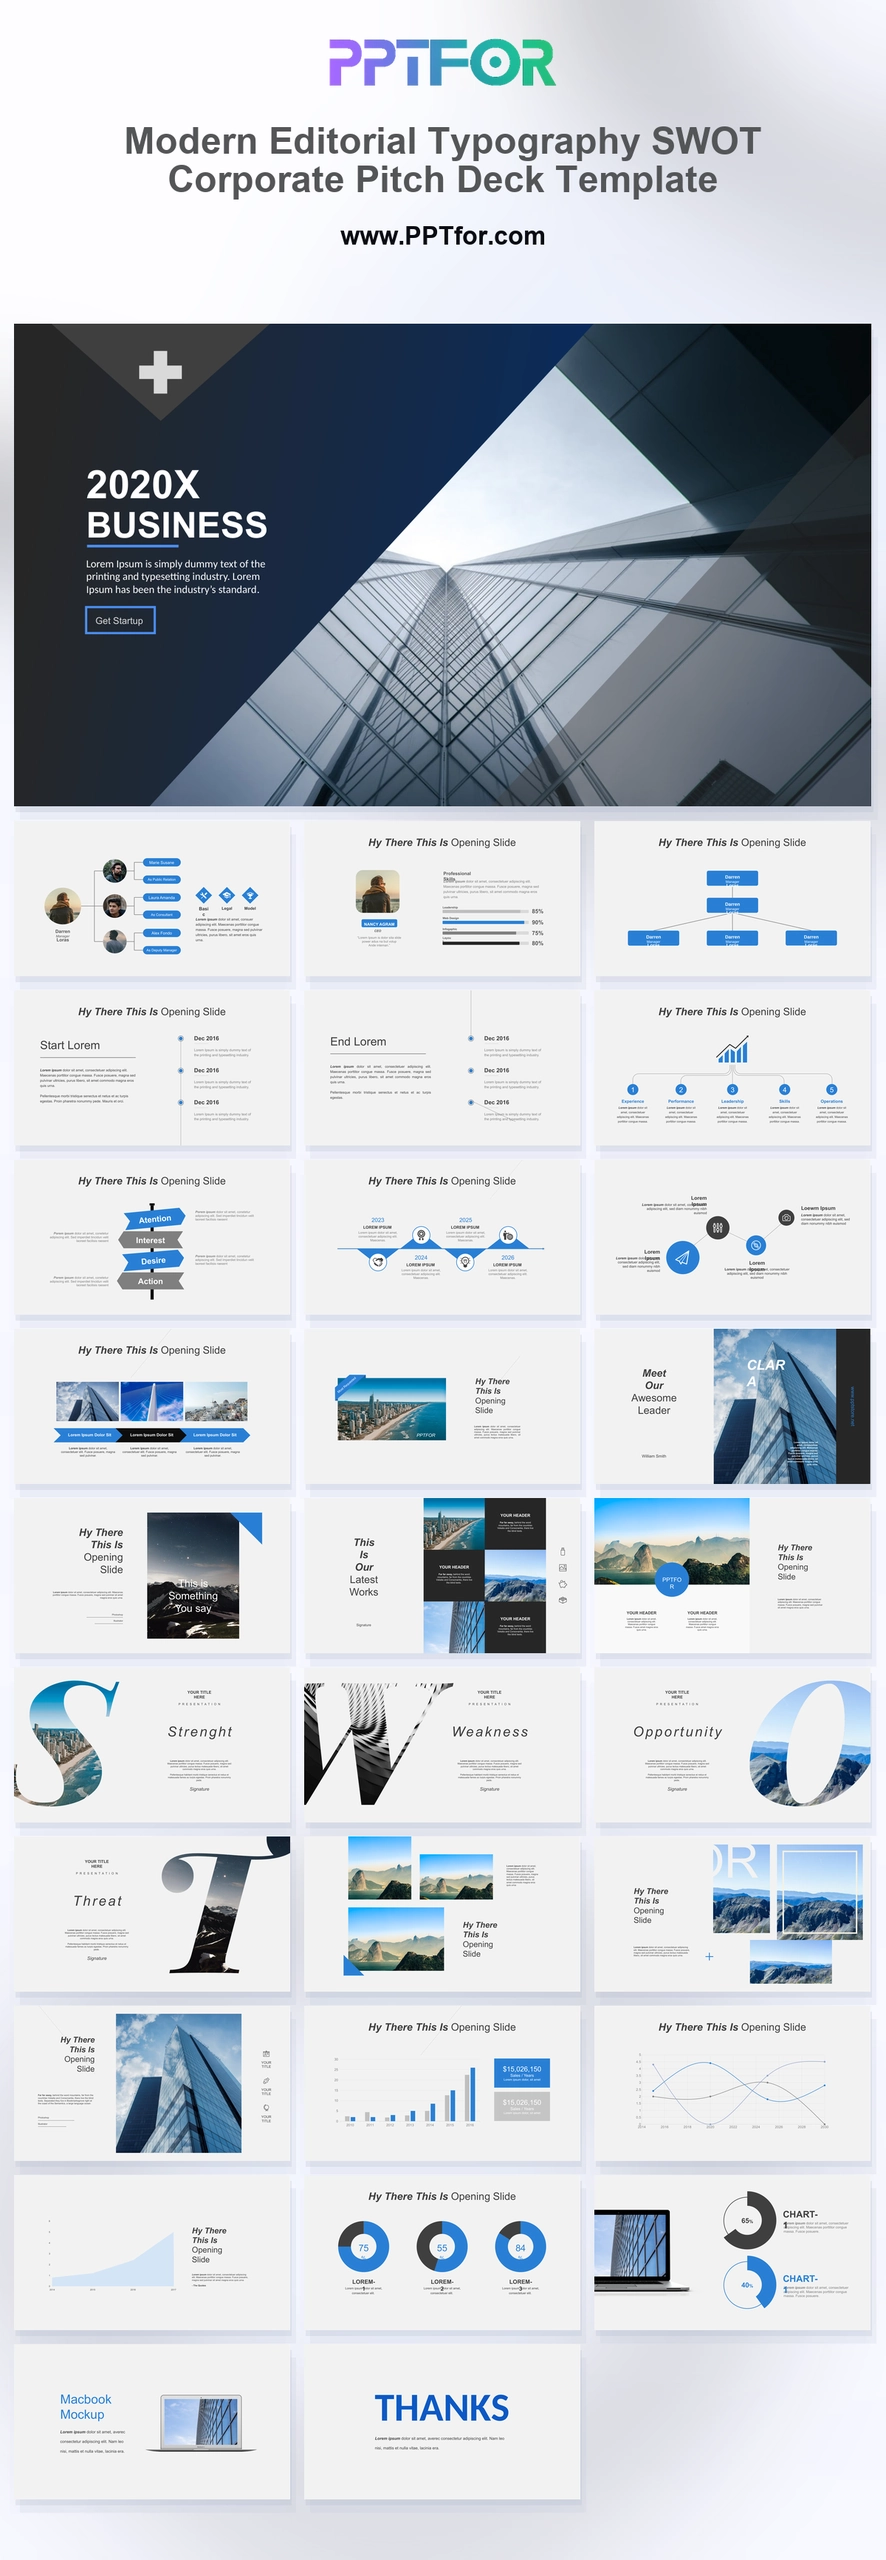
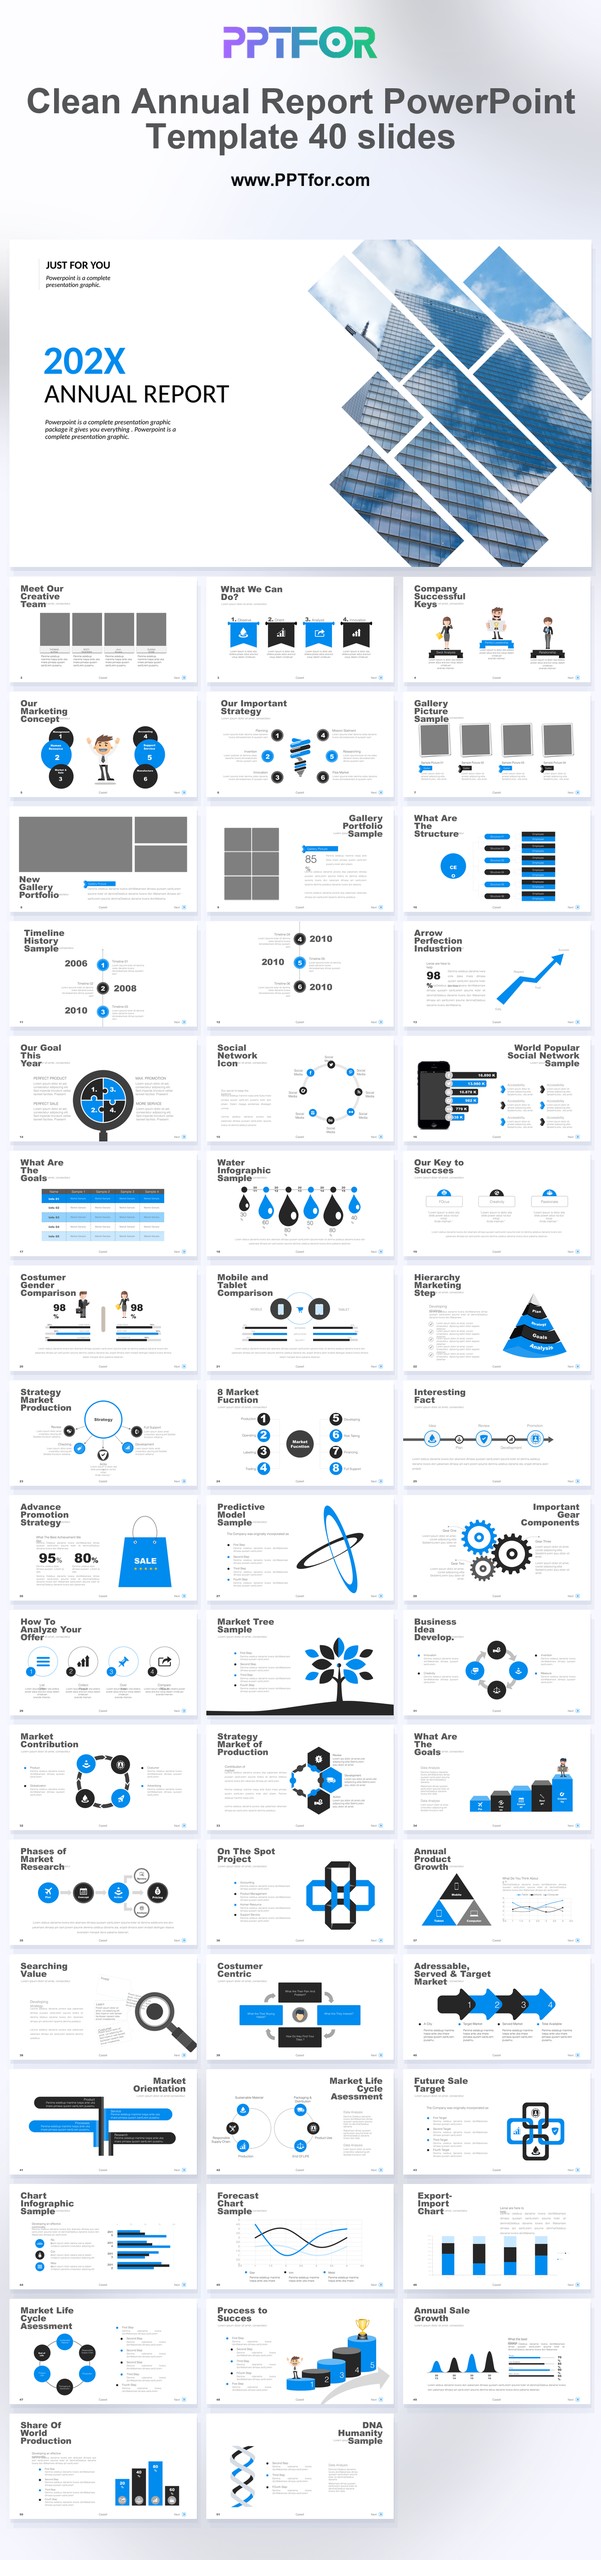
The Data Analysis PowerPoint Template gives analysts, consultants, strategy teams, and business leaders a clean corporate deck for explaining research findings with structure and focus. Its blue and white color system supports trust and stability, while the SWOT layouts, market analysis sections, company report flow, and data analysis pages make complex information easier to compare. The infographic-style direction can help organize key metrics, trend analysis, and data-driven insights without making the presentation feel crowded. Built for Microsoft PowerPoint, Google Slides, and Apple Keynote, the 40-slide deck includes editable layouts, vector graphics, and drag-and-drop placeholders so teams can adapt the content to their own reporting process. Download it to turn raw analysis into a clearer business presentation.
It is best used for presenting data analysis, SWOT reviews, market findings, company report summaries, and performance indicators in a structured deck for internal meetings, client updates, or executive reviews.
Analysts, consultants, marketing teams, strategy groups, and business leaders can use it when they need to explain research findings, compare market signals, or turn data-driven insights into a clearer presentation.
The deck supports SWOT analysis, market analysis, company report content, and data analysis pages, giving teams a practical structure for presenting findings, context, interpretation, and recommendations.
Yes. The slides are fully customizable and include vector graphics plus drag-and-drop placeholders, so you can update text, colors, layouts, and brand details in PowerPoint, Google Slides, or Keynote.

Get full access to our entire collection of premium PPT templates for one simple price.
Forget about complex tools or technical skills—just choose, edit, and download.