 Get full access to premium PowerPoint templates at a limited-time price.Get Now
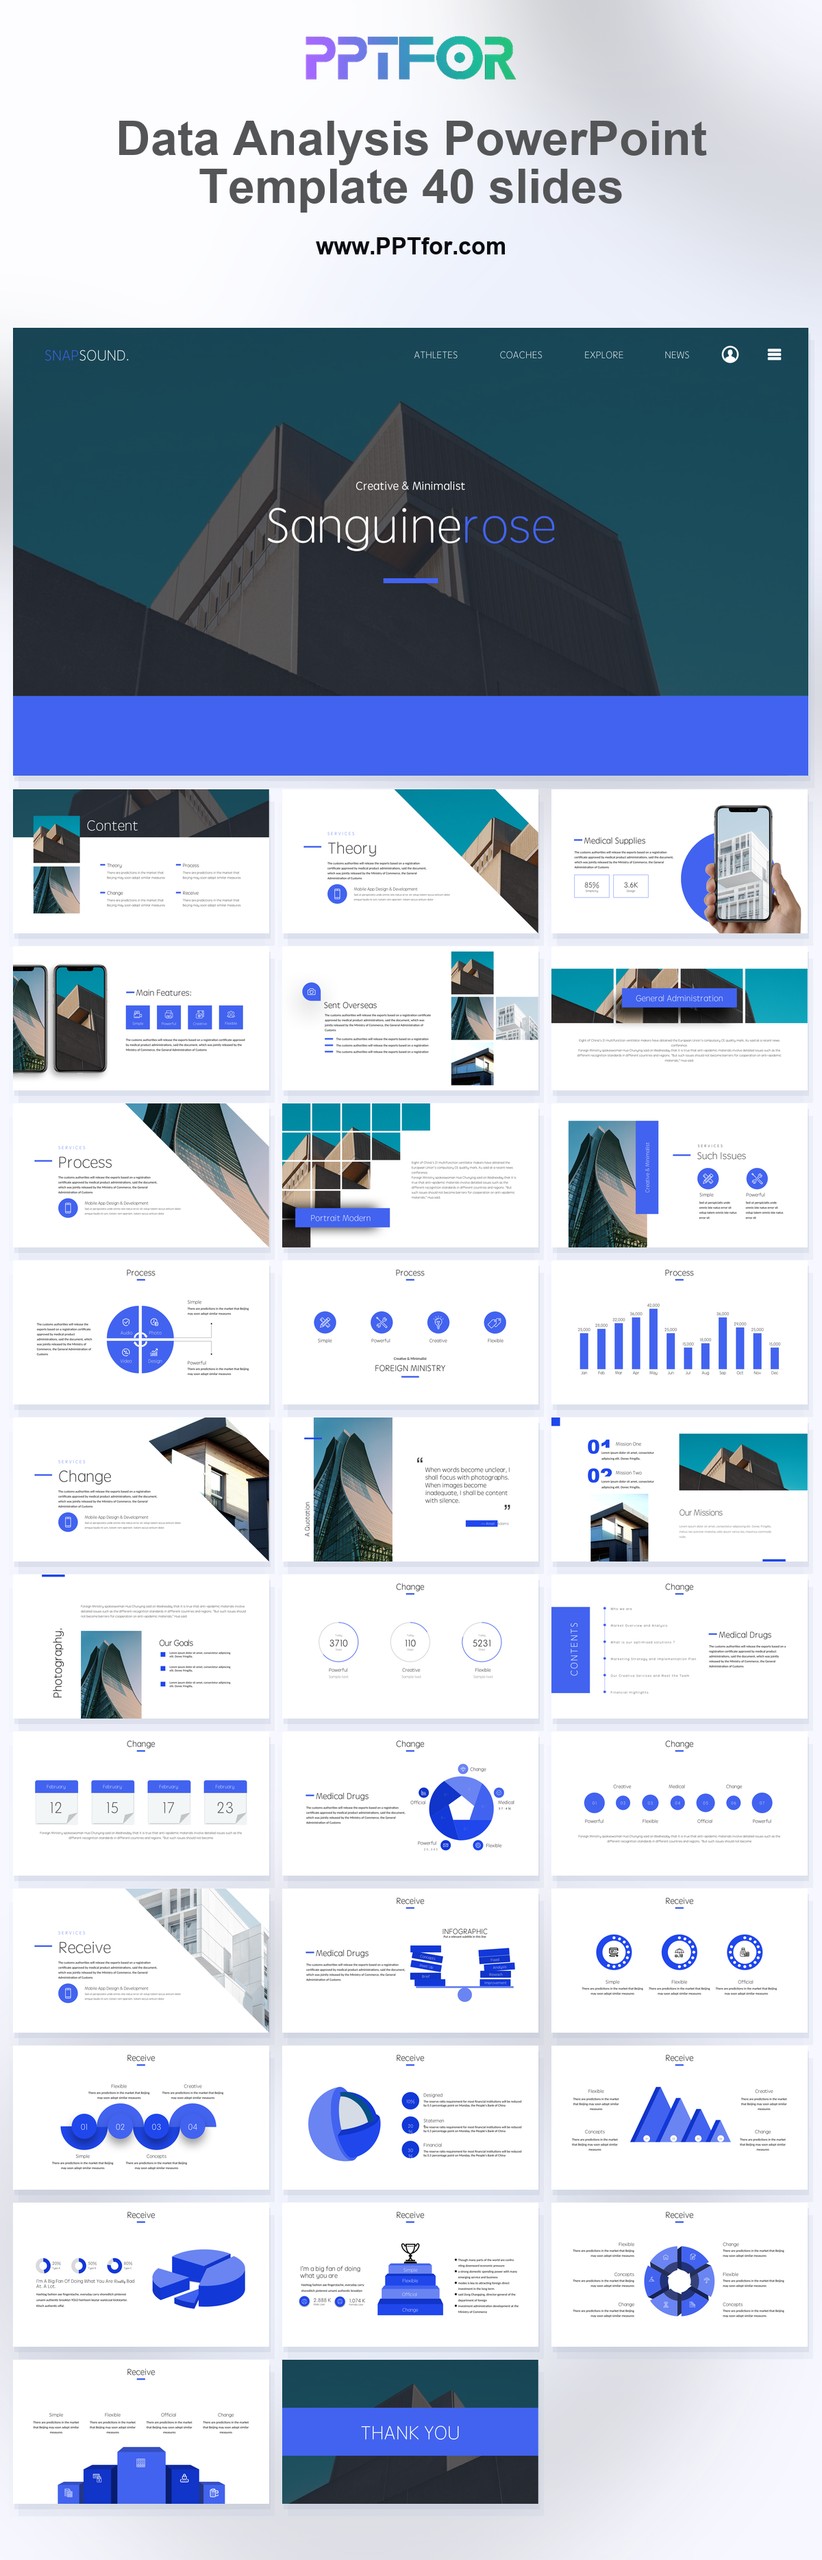
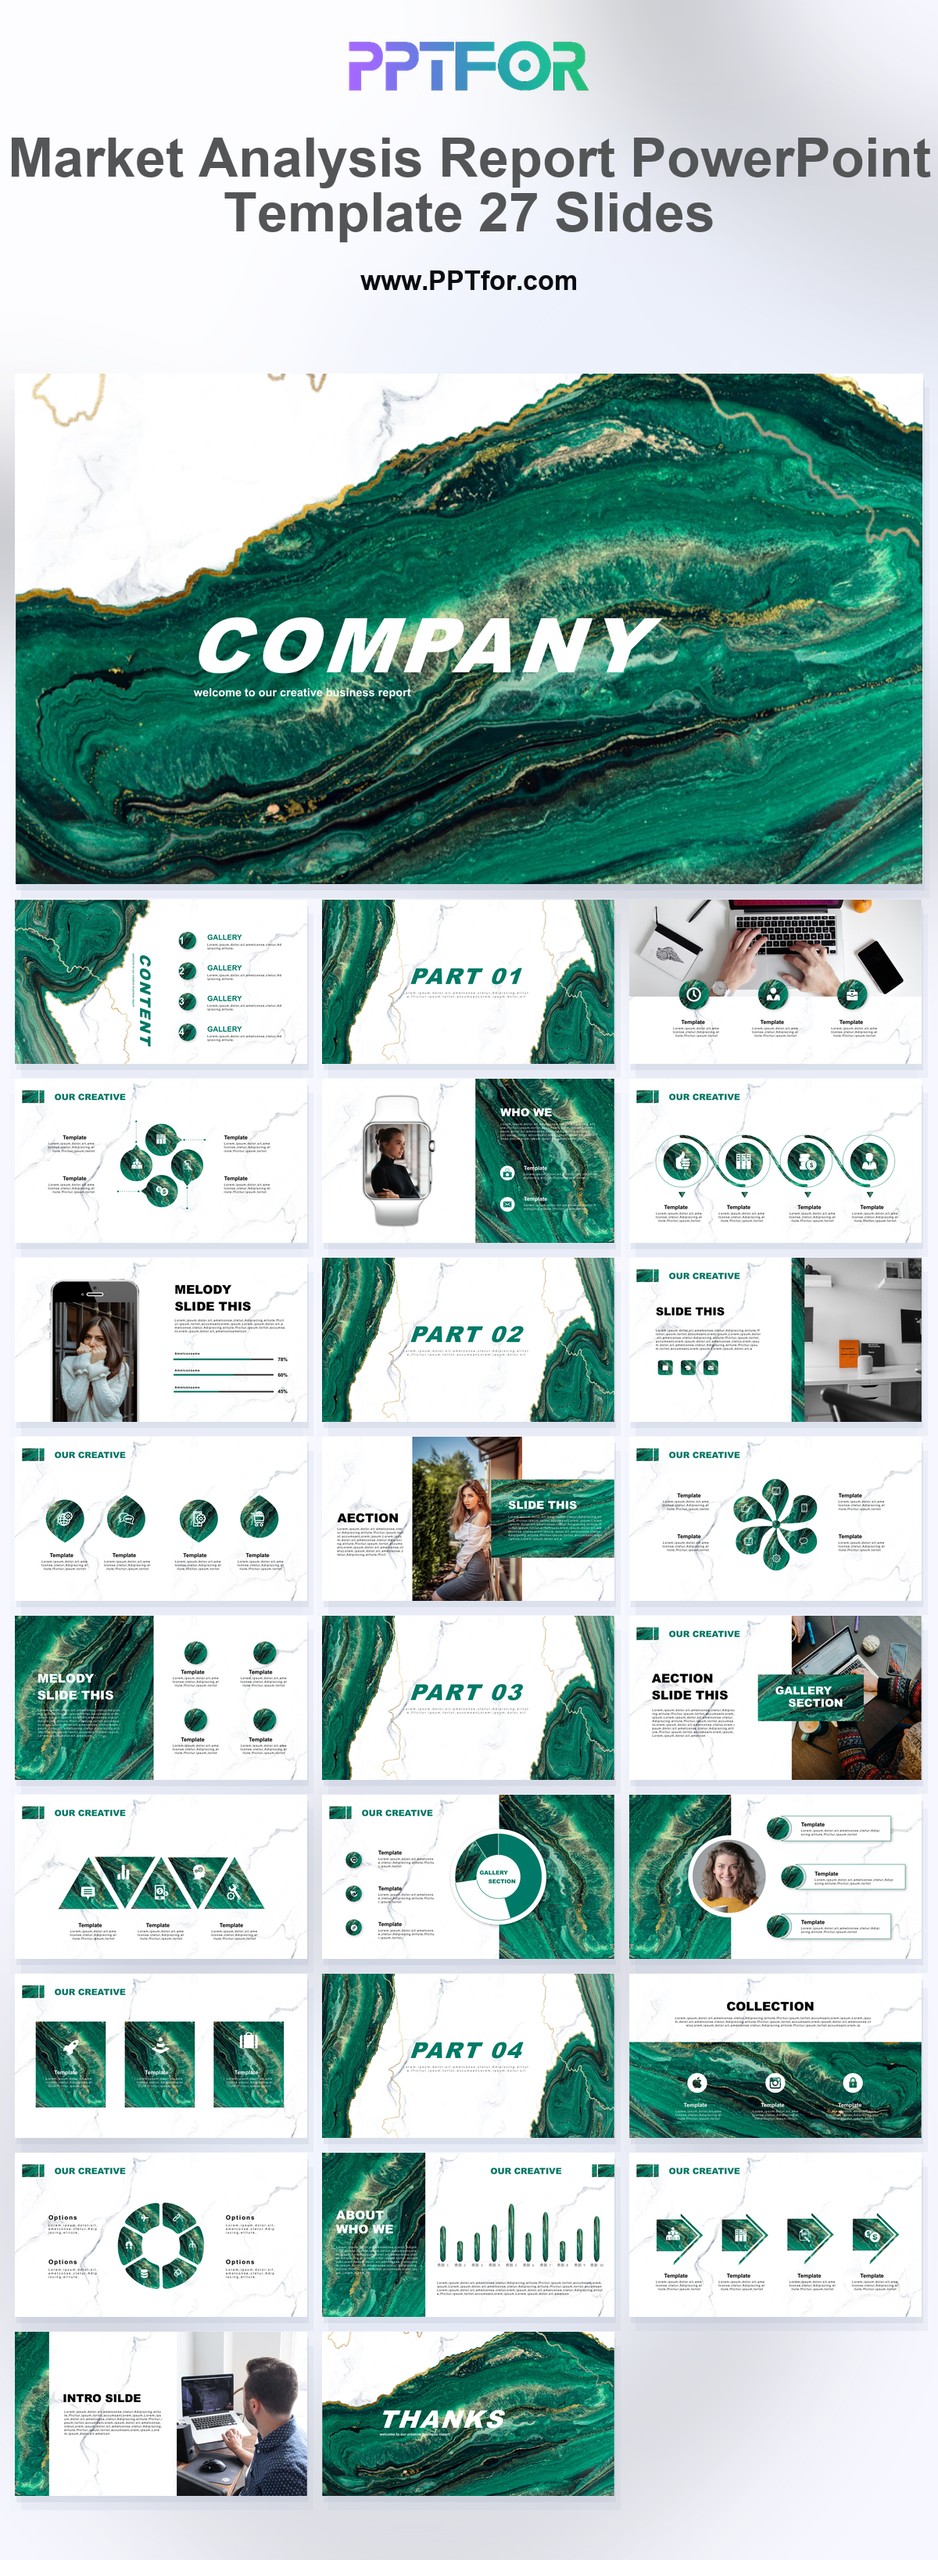
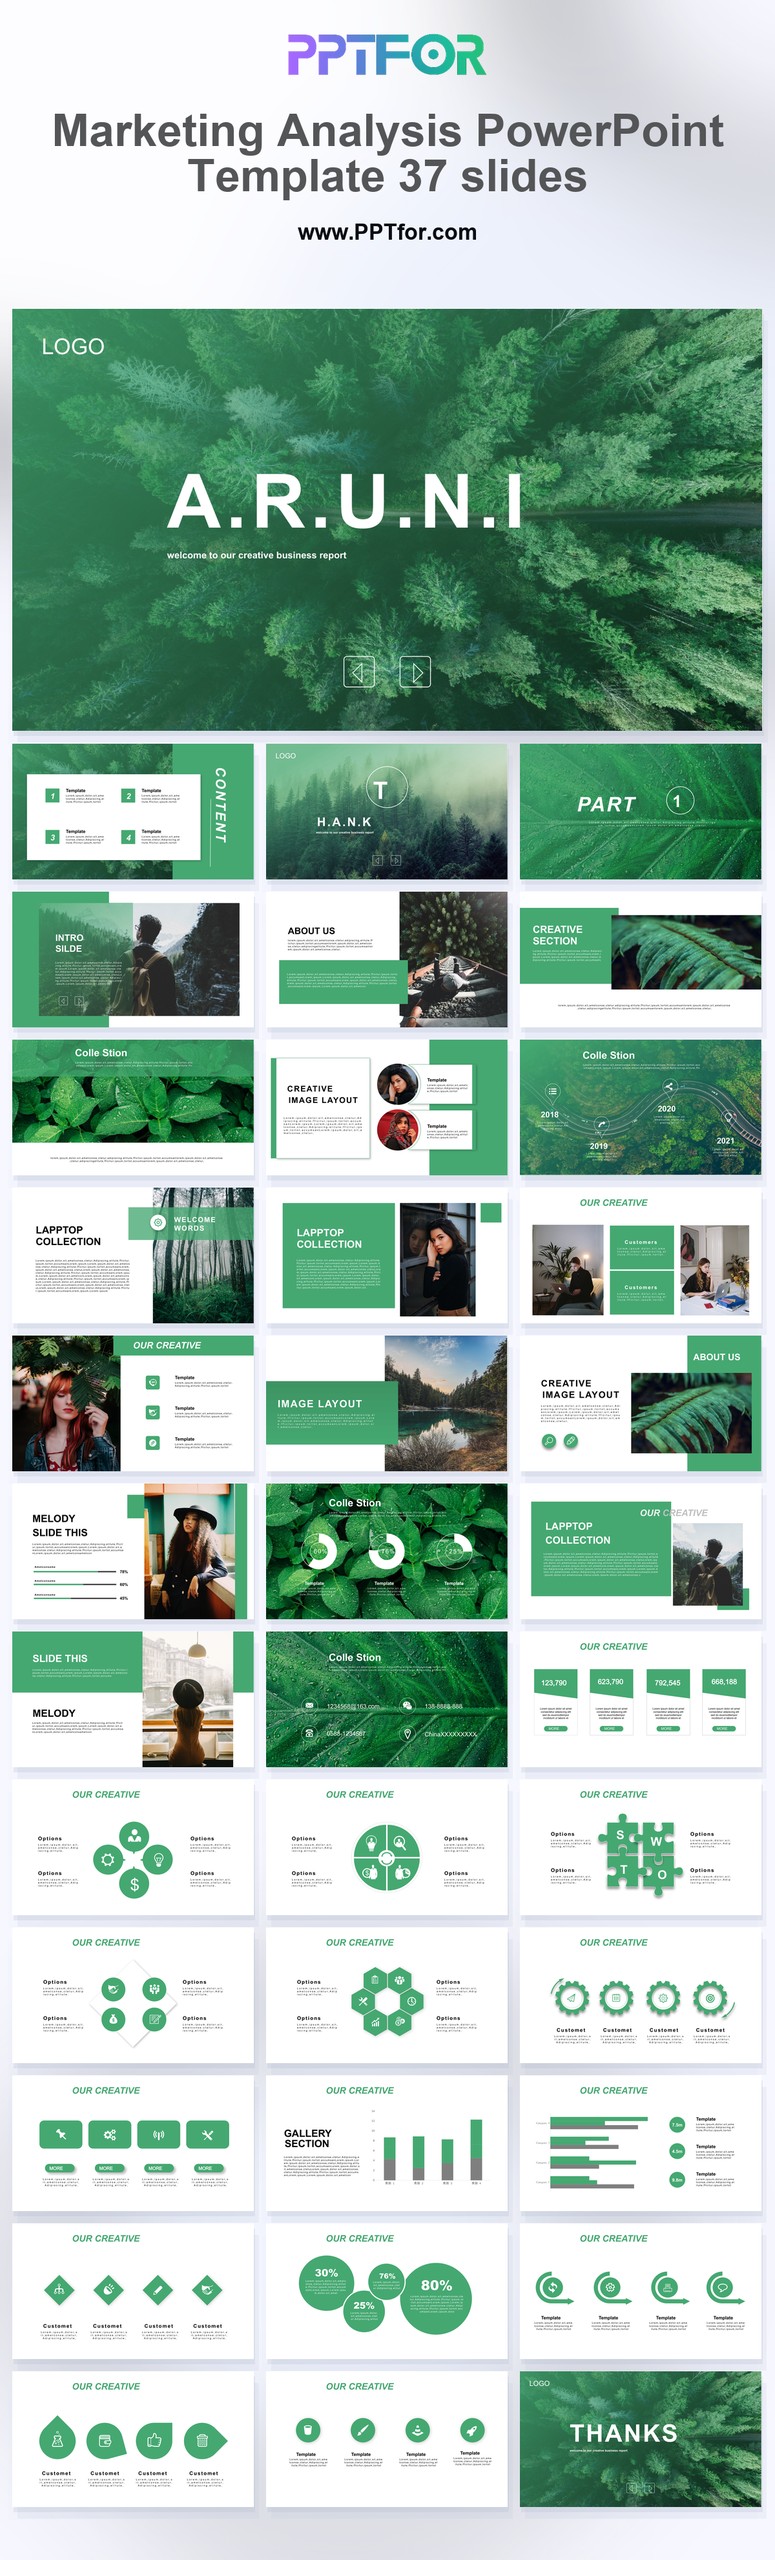
Analytics Reports templates give teams a focused collection of presentation layouts for turning performance findings, key metrics, and trend analysis into business-ready reporting materials. The collection supports a wide range of reporting needs, from marketing reviews and executive updates to operational summaries and stakeholder briefings.
Rather than relying on a single template style, this tag offers flexible options for clean corporate reporting, data-heavy summaries, and concise performance narratives. Many templates commonly support Microsoft PowerPoint, Google Slides, and Apple Keynote, with editable layouts that help teams adapt colors, fonts, and slide structures to match their reporting context. Use this collection to compare formats, choose the right structure for your findings, and prepare analytics reports with sharper business focus.
Analytics Reports templates are best used for presenting business findings, key metrics, trend analysis, and performance indicators in a structured slide format for executives, clients, managers, or cross-functional teams.
Yes, many templates in this collection commonly include editable elements, allowing you to adjust colors, fonts, layouts, and slide content to match your brand or reporting requirements.
Most templates commonly support Microsoft PowerPoint, Google Slides, and Apple Keynote, though buyers should review individual product details to confirm exact compatibility before downloading.
They save time by giving teams pre-structured reporting layouts, so analysts and managers can focus on findings, recommendations, and business context instead of rebuilding slides manually.
Get full access to our entire collection of premium PPT templates for one simple price.
Forget about complex tools or technical skills—just choose, edit, and download.