Get full access to premium PowerPoint templates at a limited-time price.Get Now
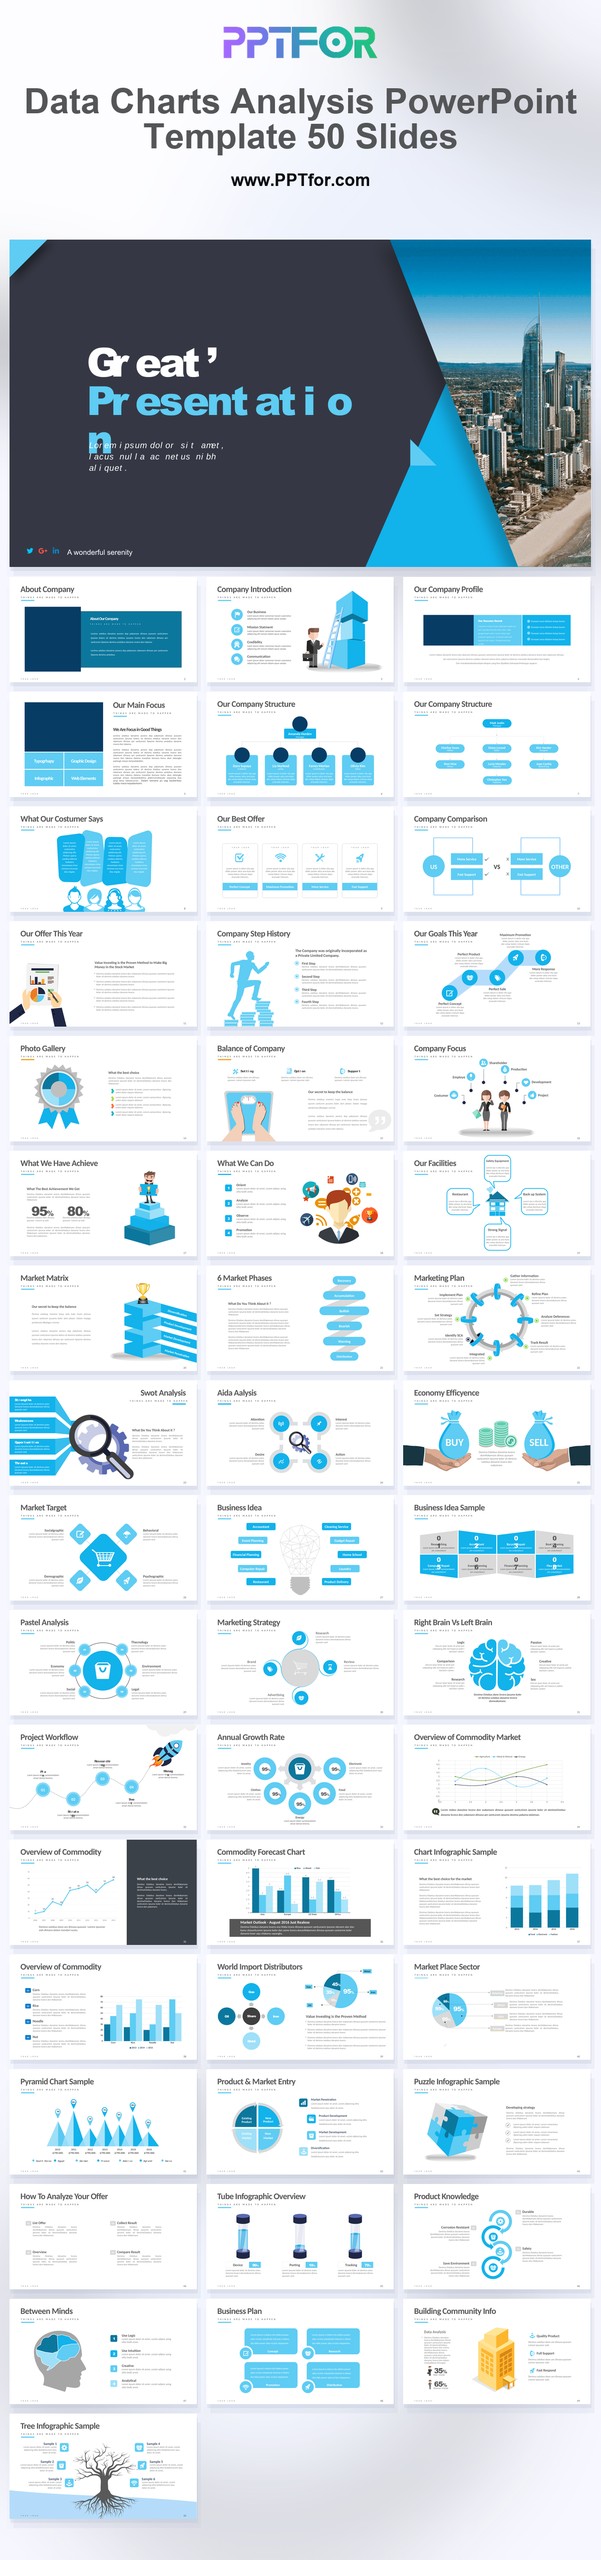
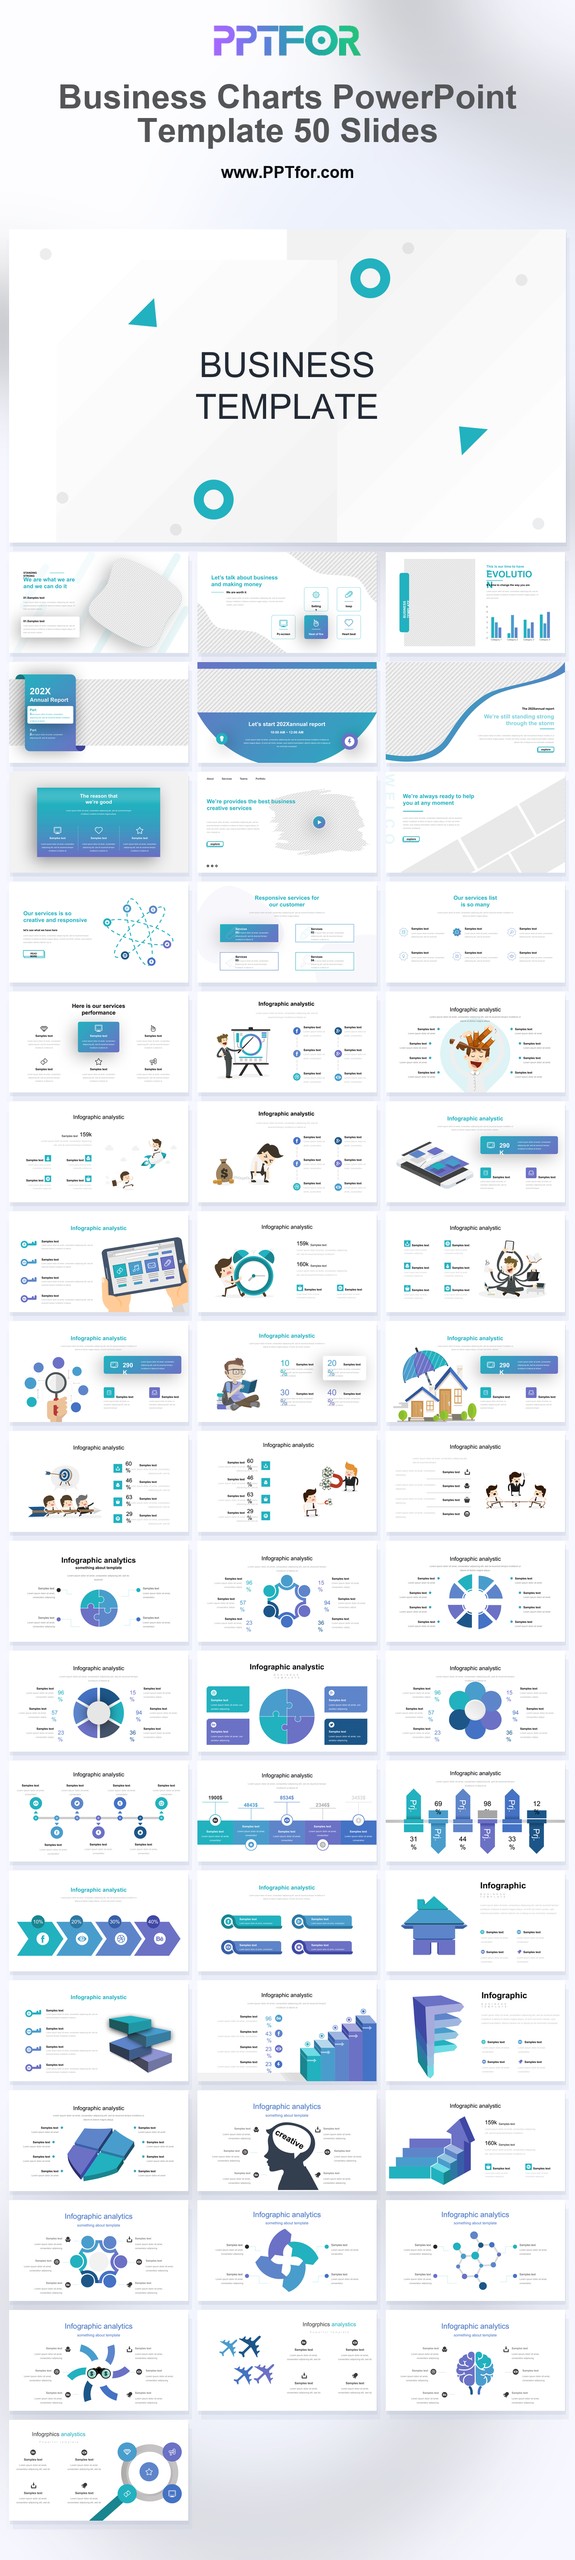
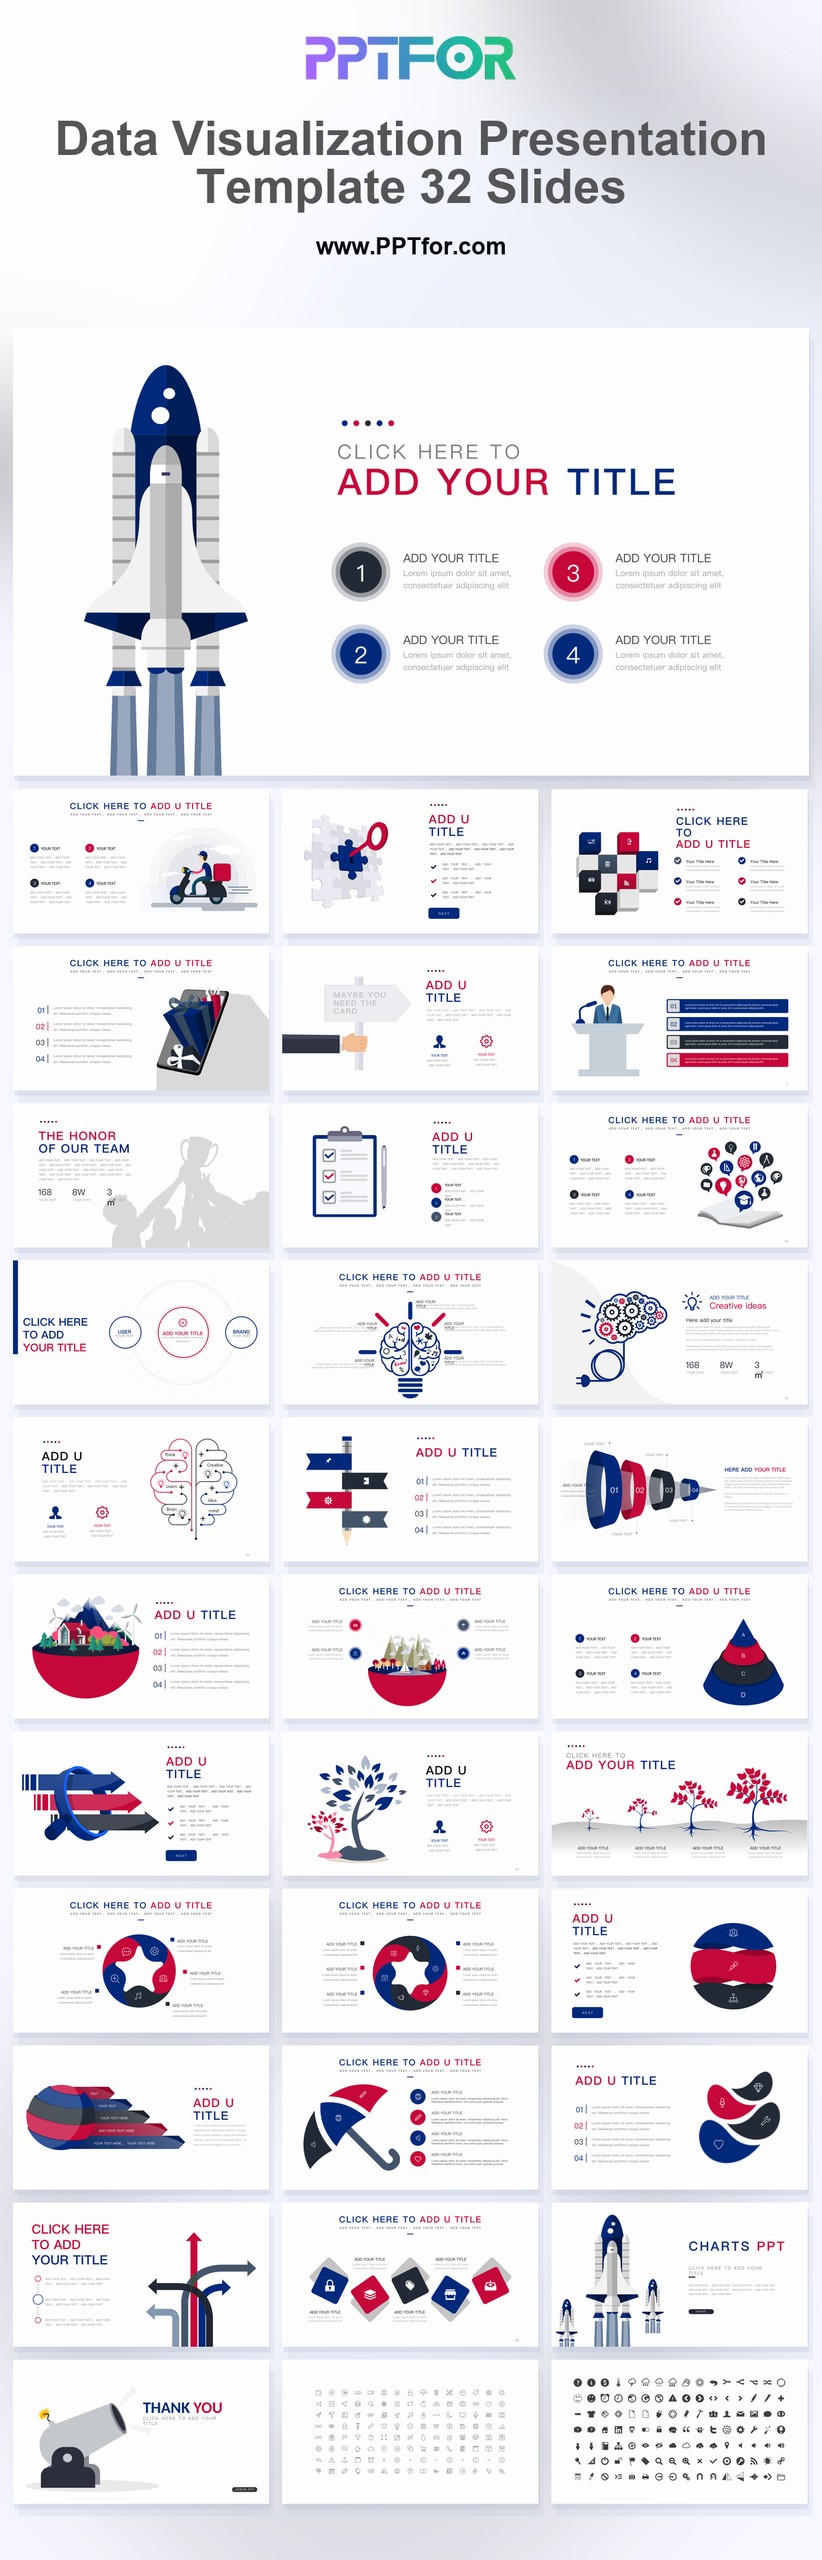
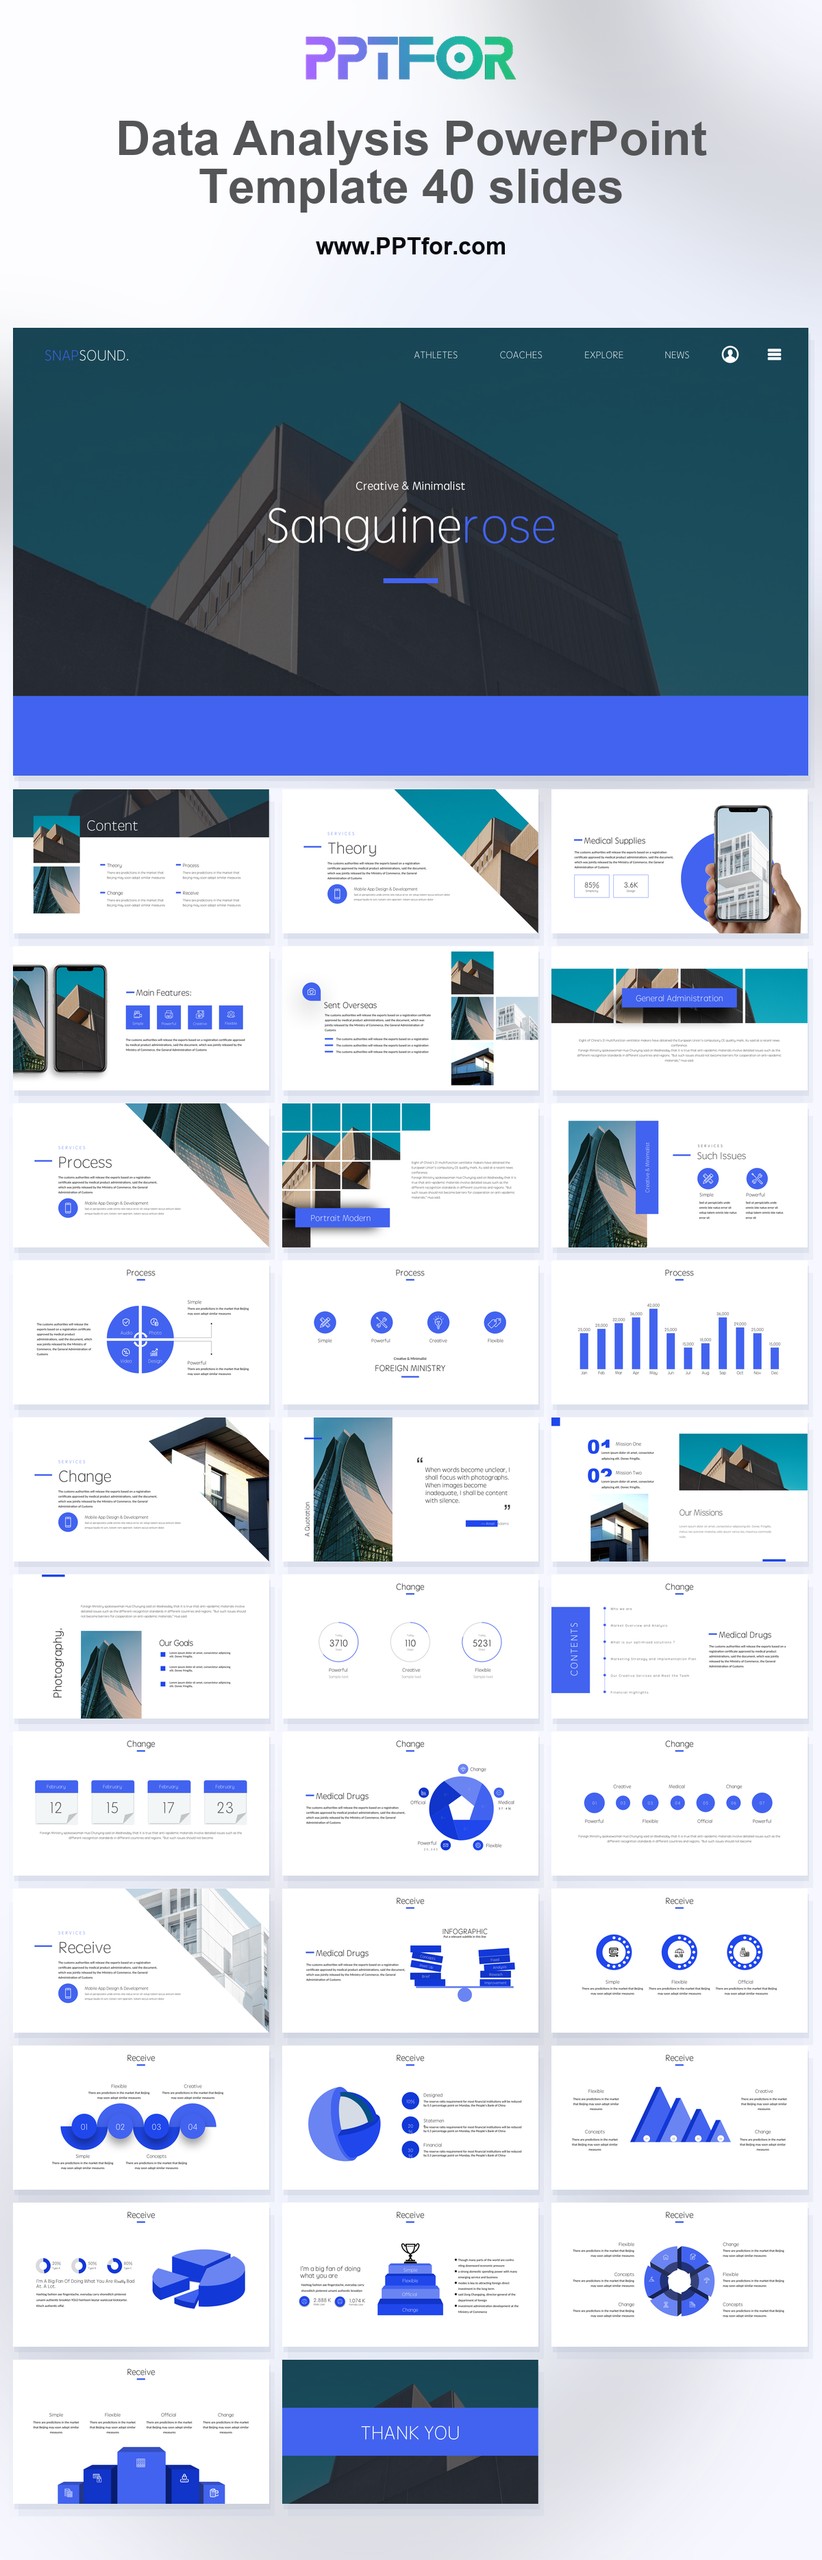
Infographic PowerPoint templates help analysts, consultants, marketers, project teams, trainers, and founders explain information visually. Use this collection for business data, processes, timelines, comparisons, KPI dashboards, roadmaps, funnels, organizational structures, and presentation slides that would otherwise become too text-heavy.
An infographic should make a message easier to understand, not simply decorate a slide. Choose a layout that matches the relationship in your content: sequence, comparison, hierarchy, composition, location, or change over time. Every product in this collection is different, so review its preview images, slide count, and supported software before purchasing.
Use a timeline for change over time, a process diagram for ordered steps, a comparison layout for alternatives, a hierarchy for levels or reporting lines, a map for geographic information, and a chart for quantitative patterns. If the visual does not reveal a relationship, a short statement may be clearer.
| Business question | Best visual | Common use |
|---|---|---|
| What happens next? | Process or flow diagram | Operations, onboarding, customer journey |
| How did results change? | Line, bar, or slope chart | KPI and performance reporting |
| How do options differ? | Comparison matrix | Vendor, product, or strategy selection |
| What are the priorities? | Roadmap or ranked framework | Strategy and project planning |
| How is the system organized? | Hierarchy or architecture diagram | Teams, products, and operating models |
It is an editable presentation file containing visual layouts for explaining data, processes, timelines, comparisons, structures, and business concepts.
No. Use a short message, concise labels, and only the context required to interpret the visual. Move detailed explanations to speaker notes or supporting slides.
Many templates support editable colors, shapes, and icons, but exact features vary. Confirm editability and compatibility on the individual product page.
No. Use charts when accurate quantitative comparison matters. Use other infographic layouts when the message is a process, hierarchy, sequence, category, or conceptual relationship.
Get full access to our entire collection of premium PPT templates for one simple price.
Forget about complex tools or technical skills—just choose, edit, and download.