 Get full access to premium PowerPoint templates at a limited-time price.Get Now
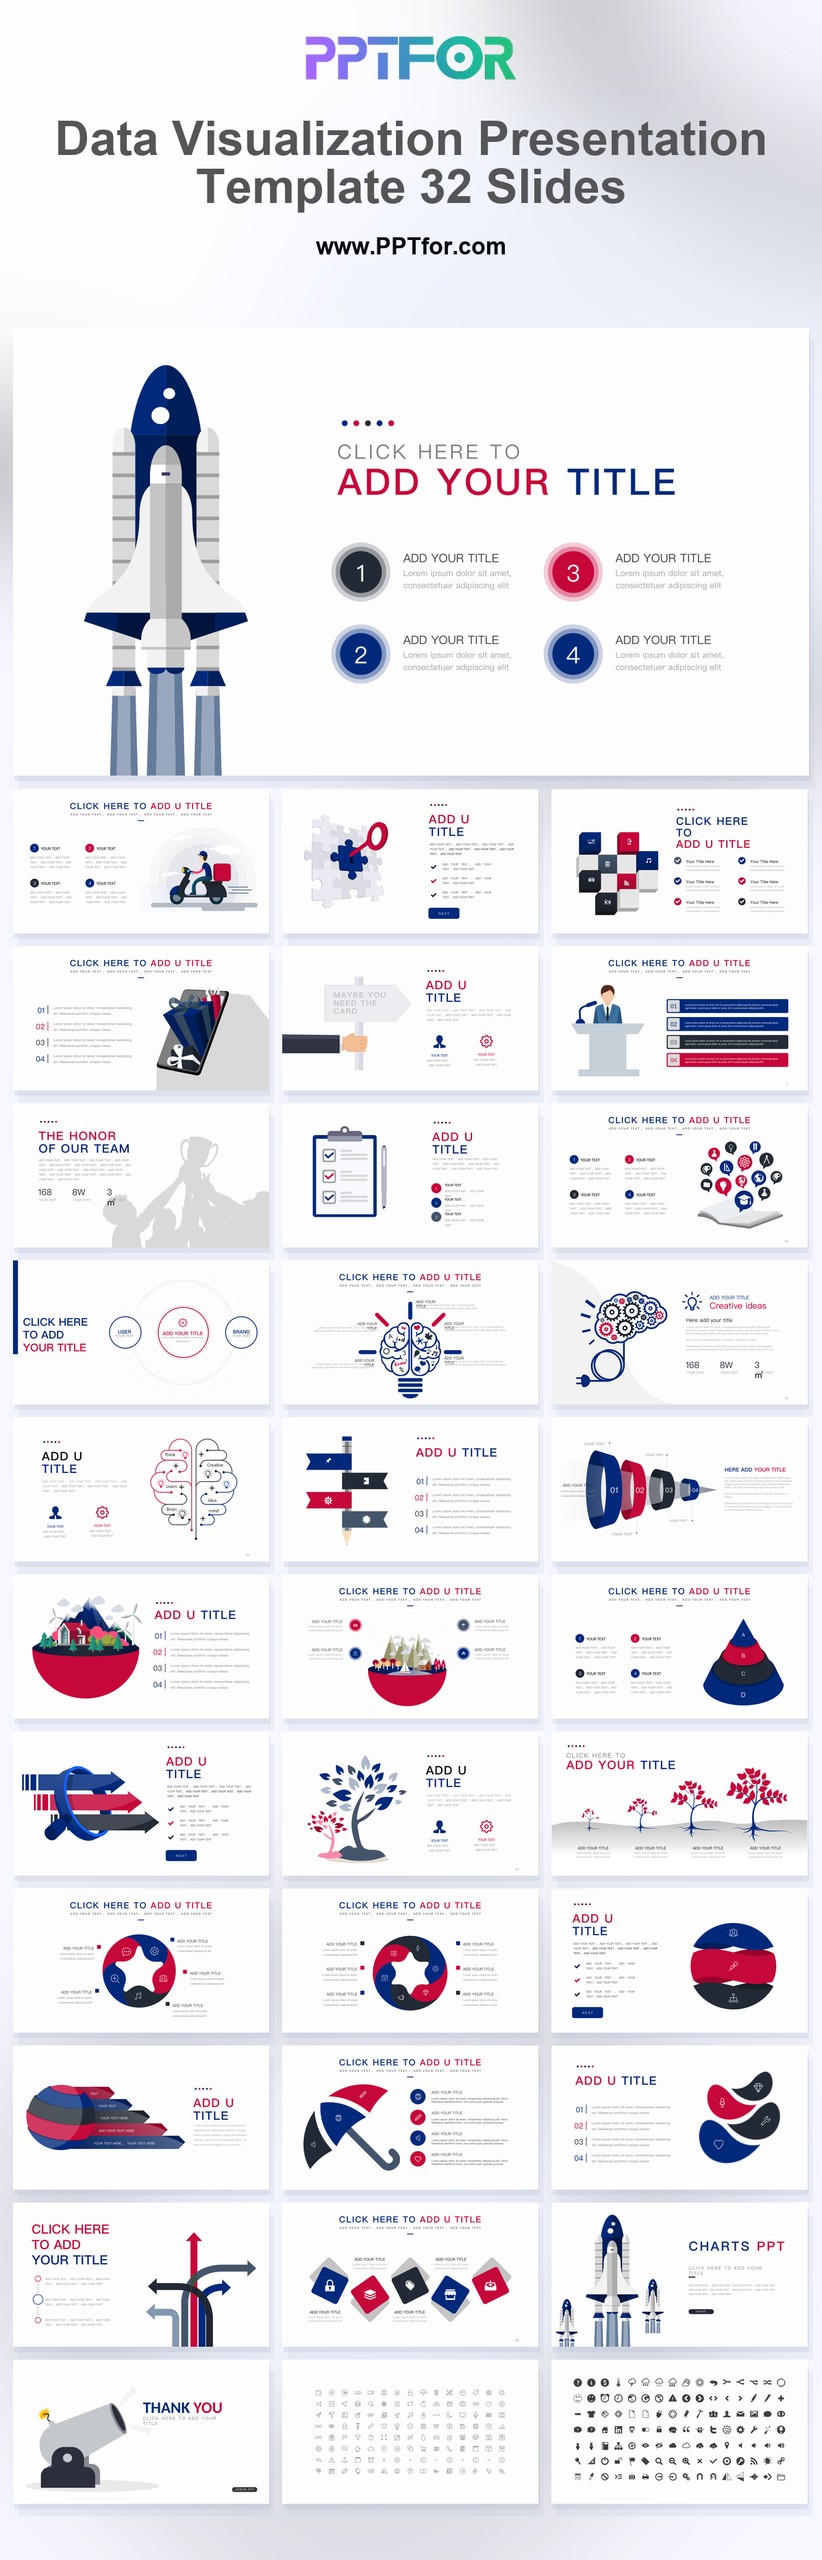
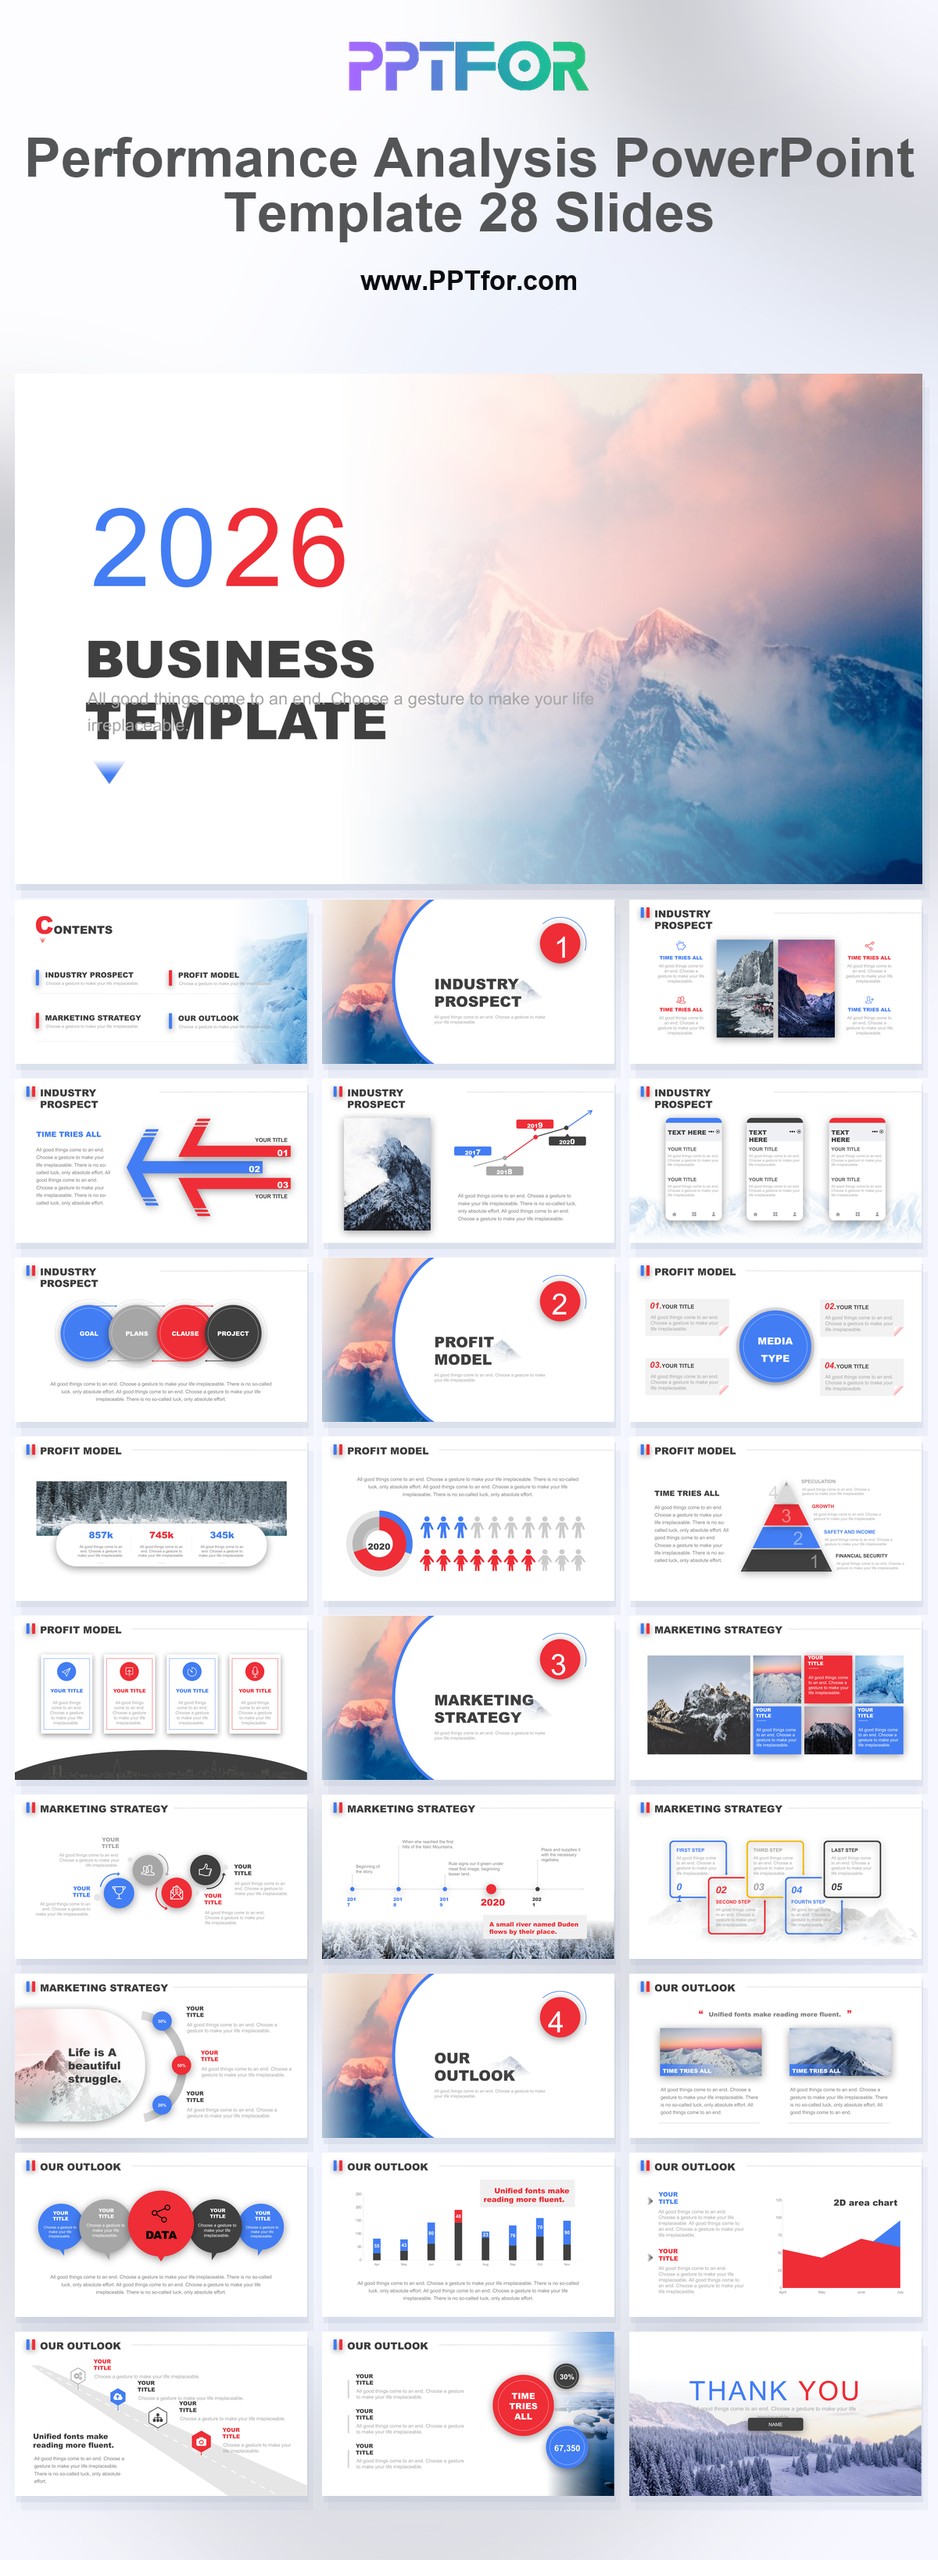
The Data Visualization Report Presentation Template gives analysts, consultants, marketing teams, and business leaders a clean corporate structure for turning complex findings into a more readable presentation. Its red and white color direction adds energy and focus, while the SWOT, market analysis, data analysis, and data visualization layouts support key metrics, trend analysis, and performance indicators without burying the message. The infographic-style approach helps organize comparisons, research summaries, and business implications in a format stakeholders can follow quickly. Built for Microsoft PowerPoint, Google Slides, and Apple Keynote, this 32-slide template includes fully customizable slides, vector graphics, and drag-and-drop placeholders for faster report preparation. Download it to turn raw analysis into a focused presentation for your next review.
It is best used for presenting data visualization, SWOT analysis, market research, performance indicators, and business findings in a structured report deck for client meetings, internal reviews, or executive updates.
Analysts, consultants, marketing teams, project managers, and business leaders can use it when they need to explain complex findings, compare data points, and turn analysis into practical recommendations.
The template supports SWOT, market analysis, data analysis, and data visualization layouts, giving teams a clear structure for presenting research context, comparisons, key metrics, and report conclusions.
Yes. The deck includes fully customizable slides, vector graphics, and drag-and-drop placeholders, so you can update text, colors, charts, images, and brand details in PowerPoint, Google Slides, or Keynote.

Get full access to our entire collection of premium PPT templates for one simple price.
Forget about complex tools or technical skills—just choose, edit, and download.