 Get full access to premium PowerPoint templates at a limited-time price.Get Now
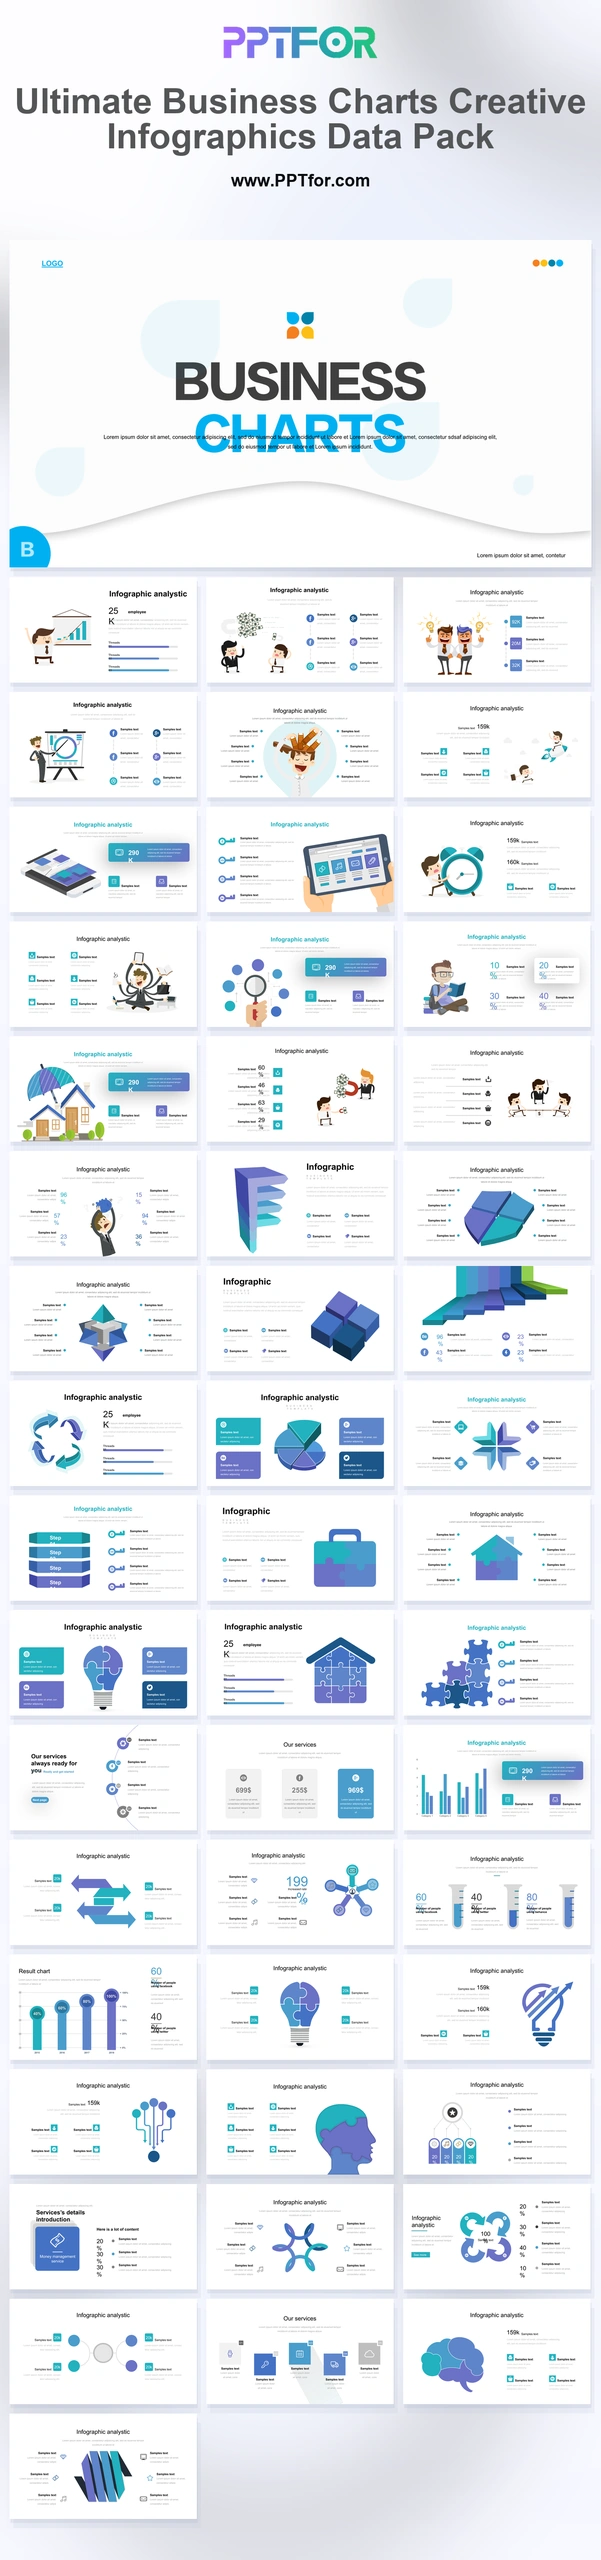
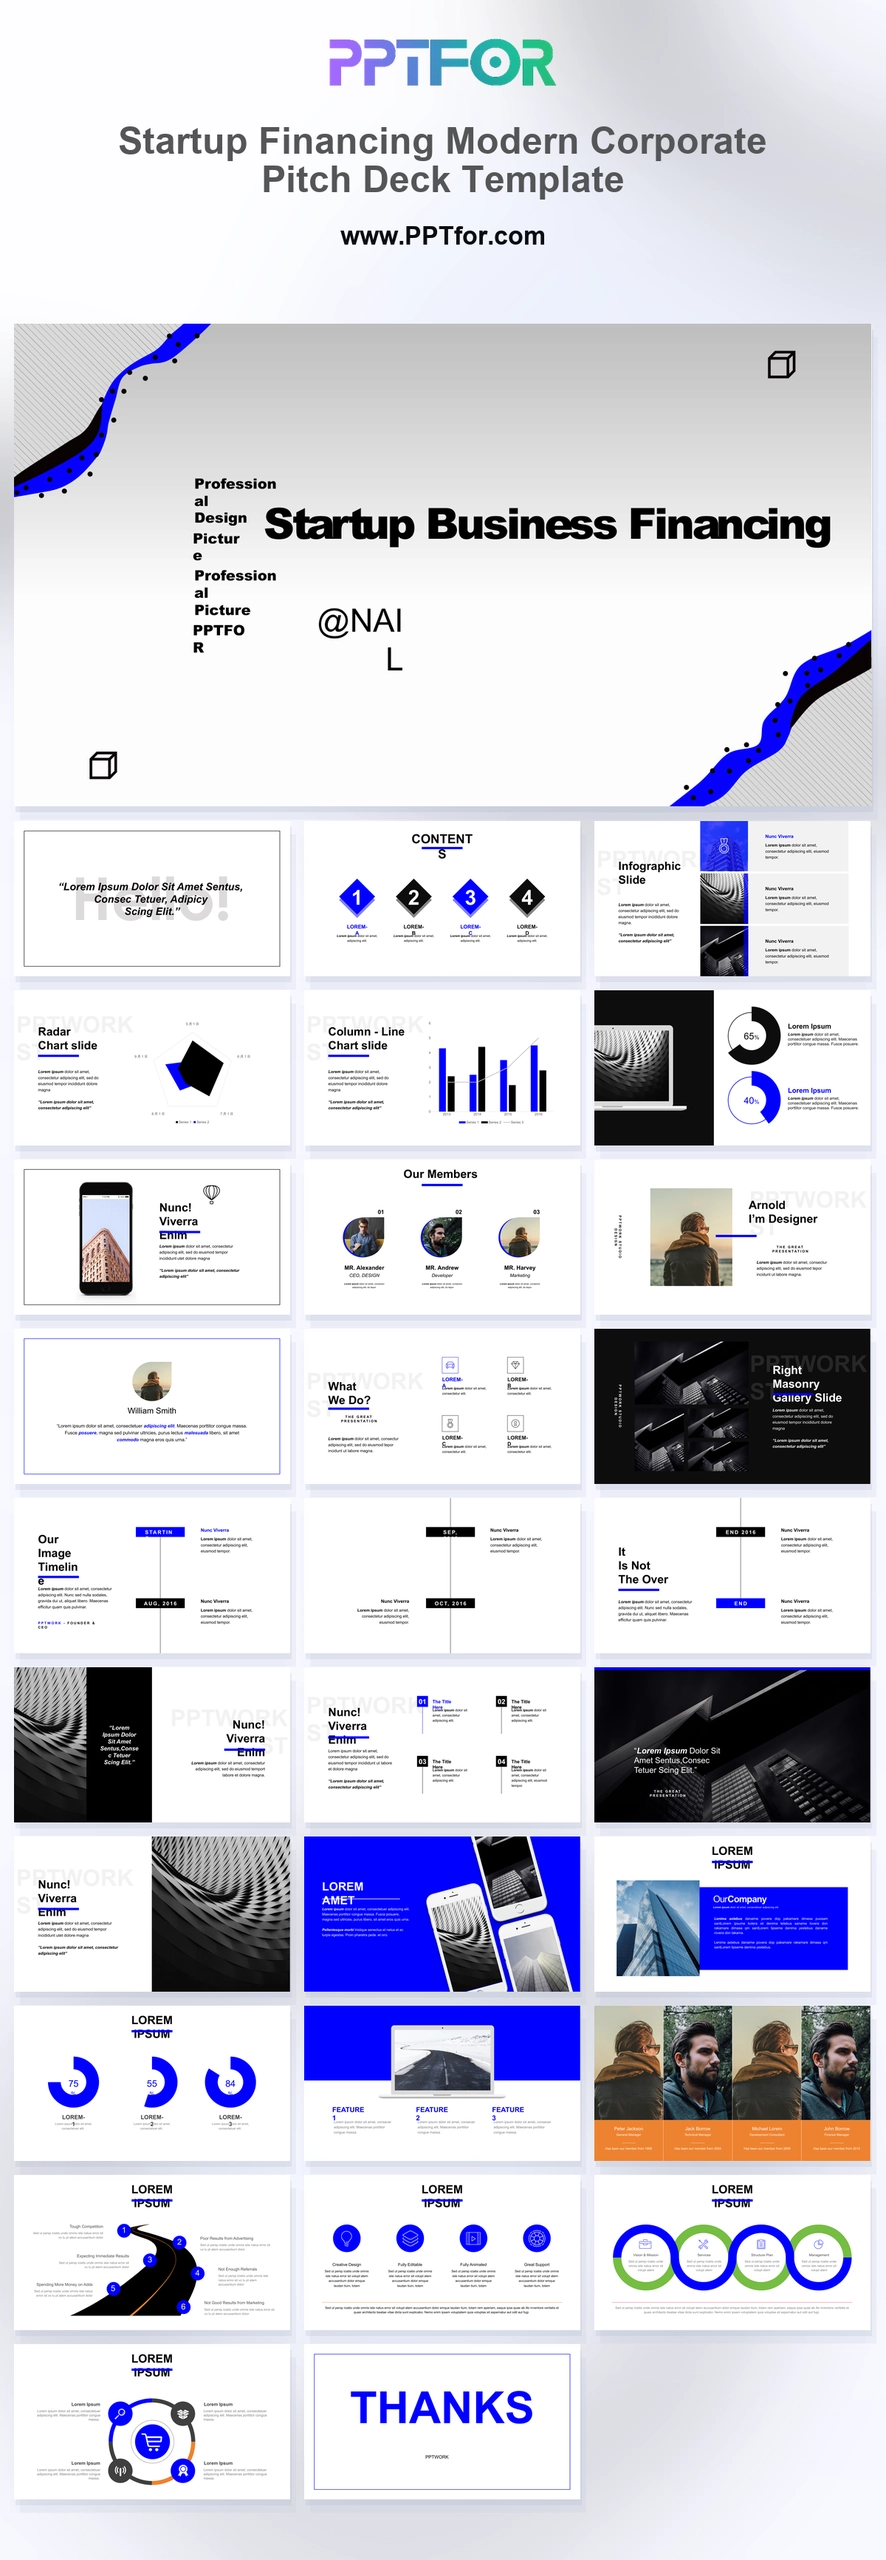
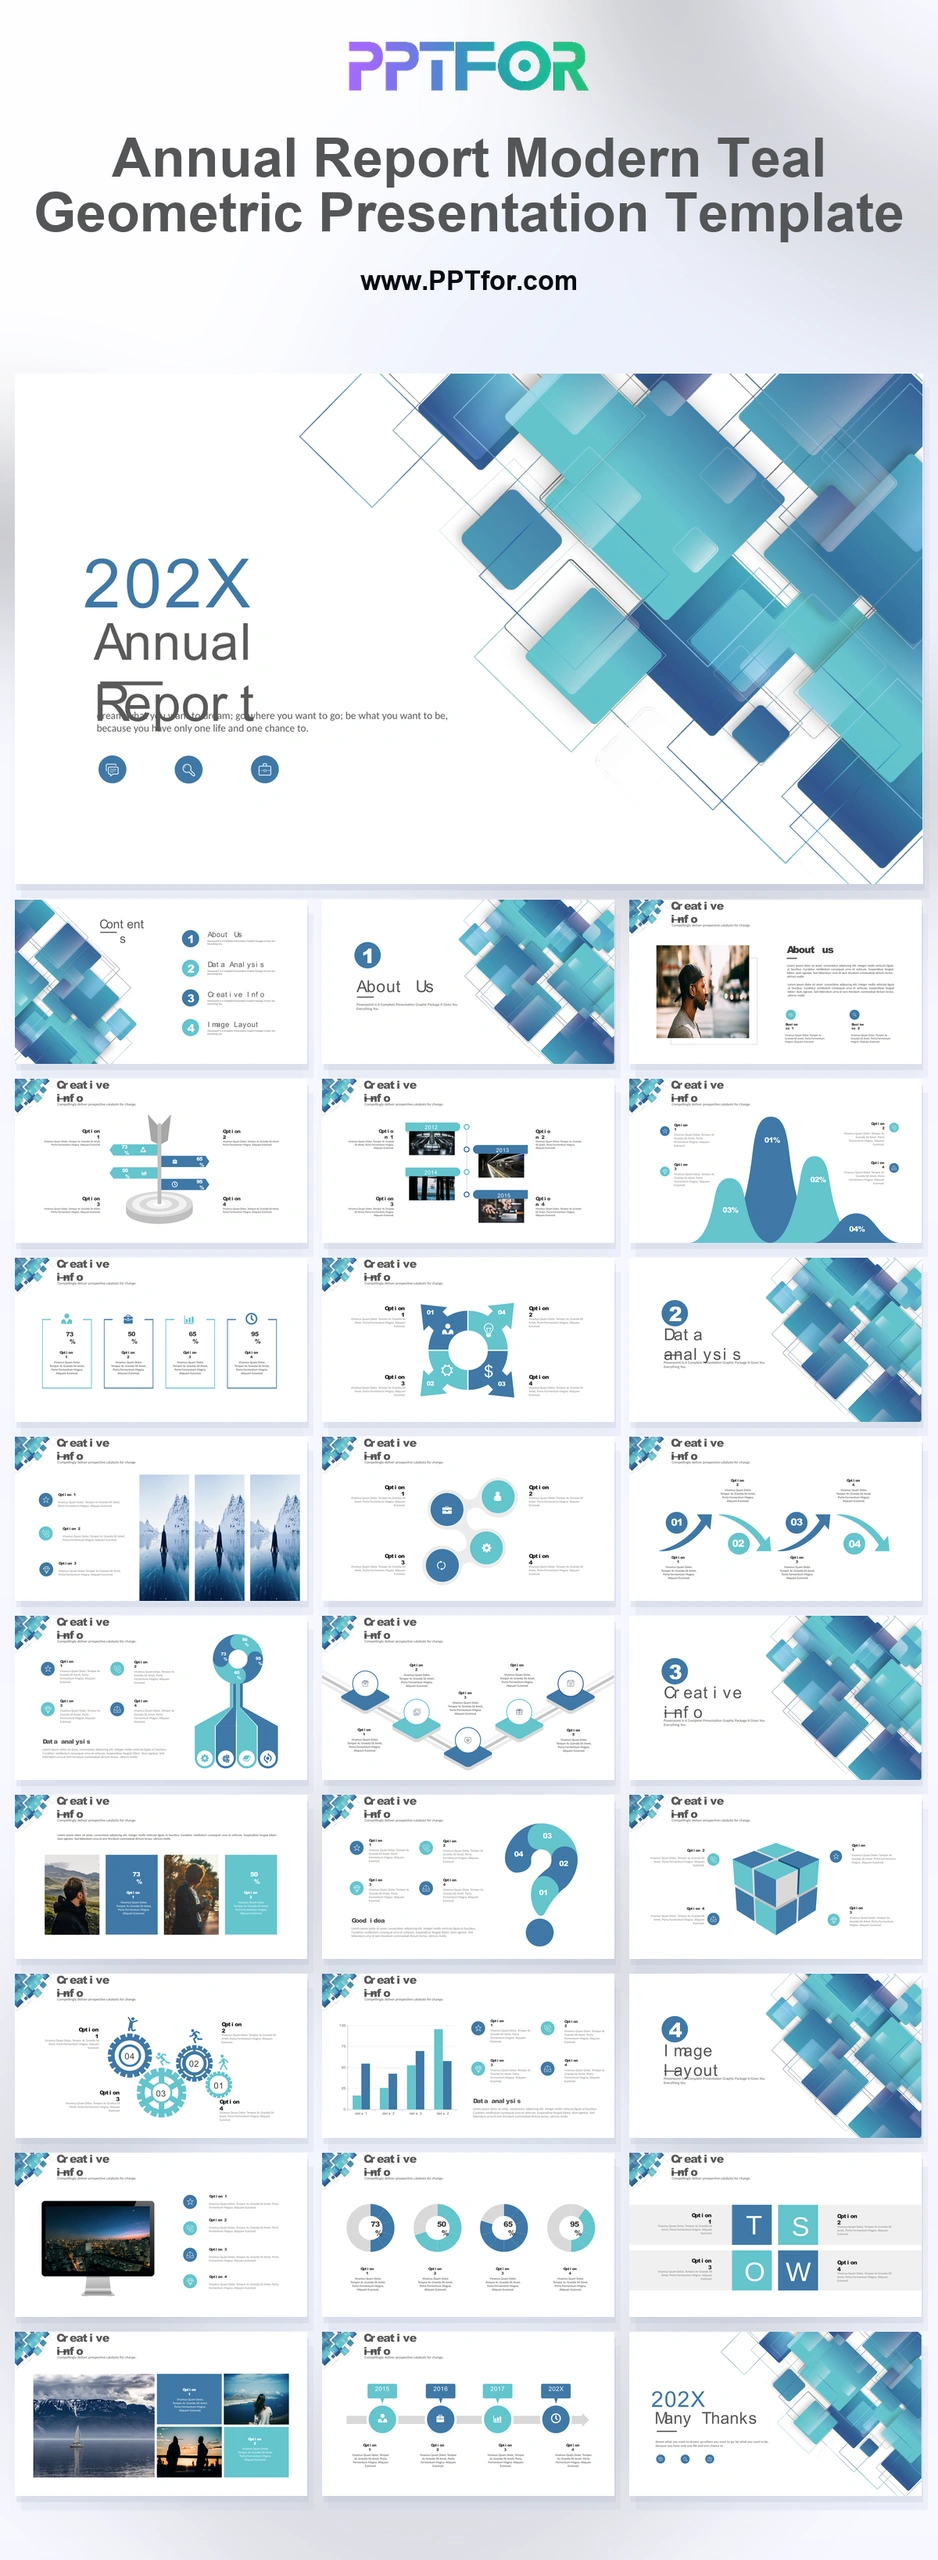
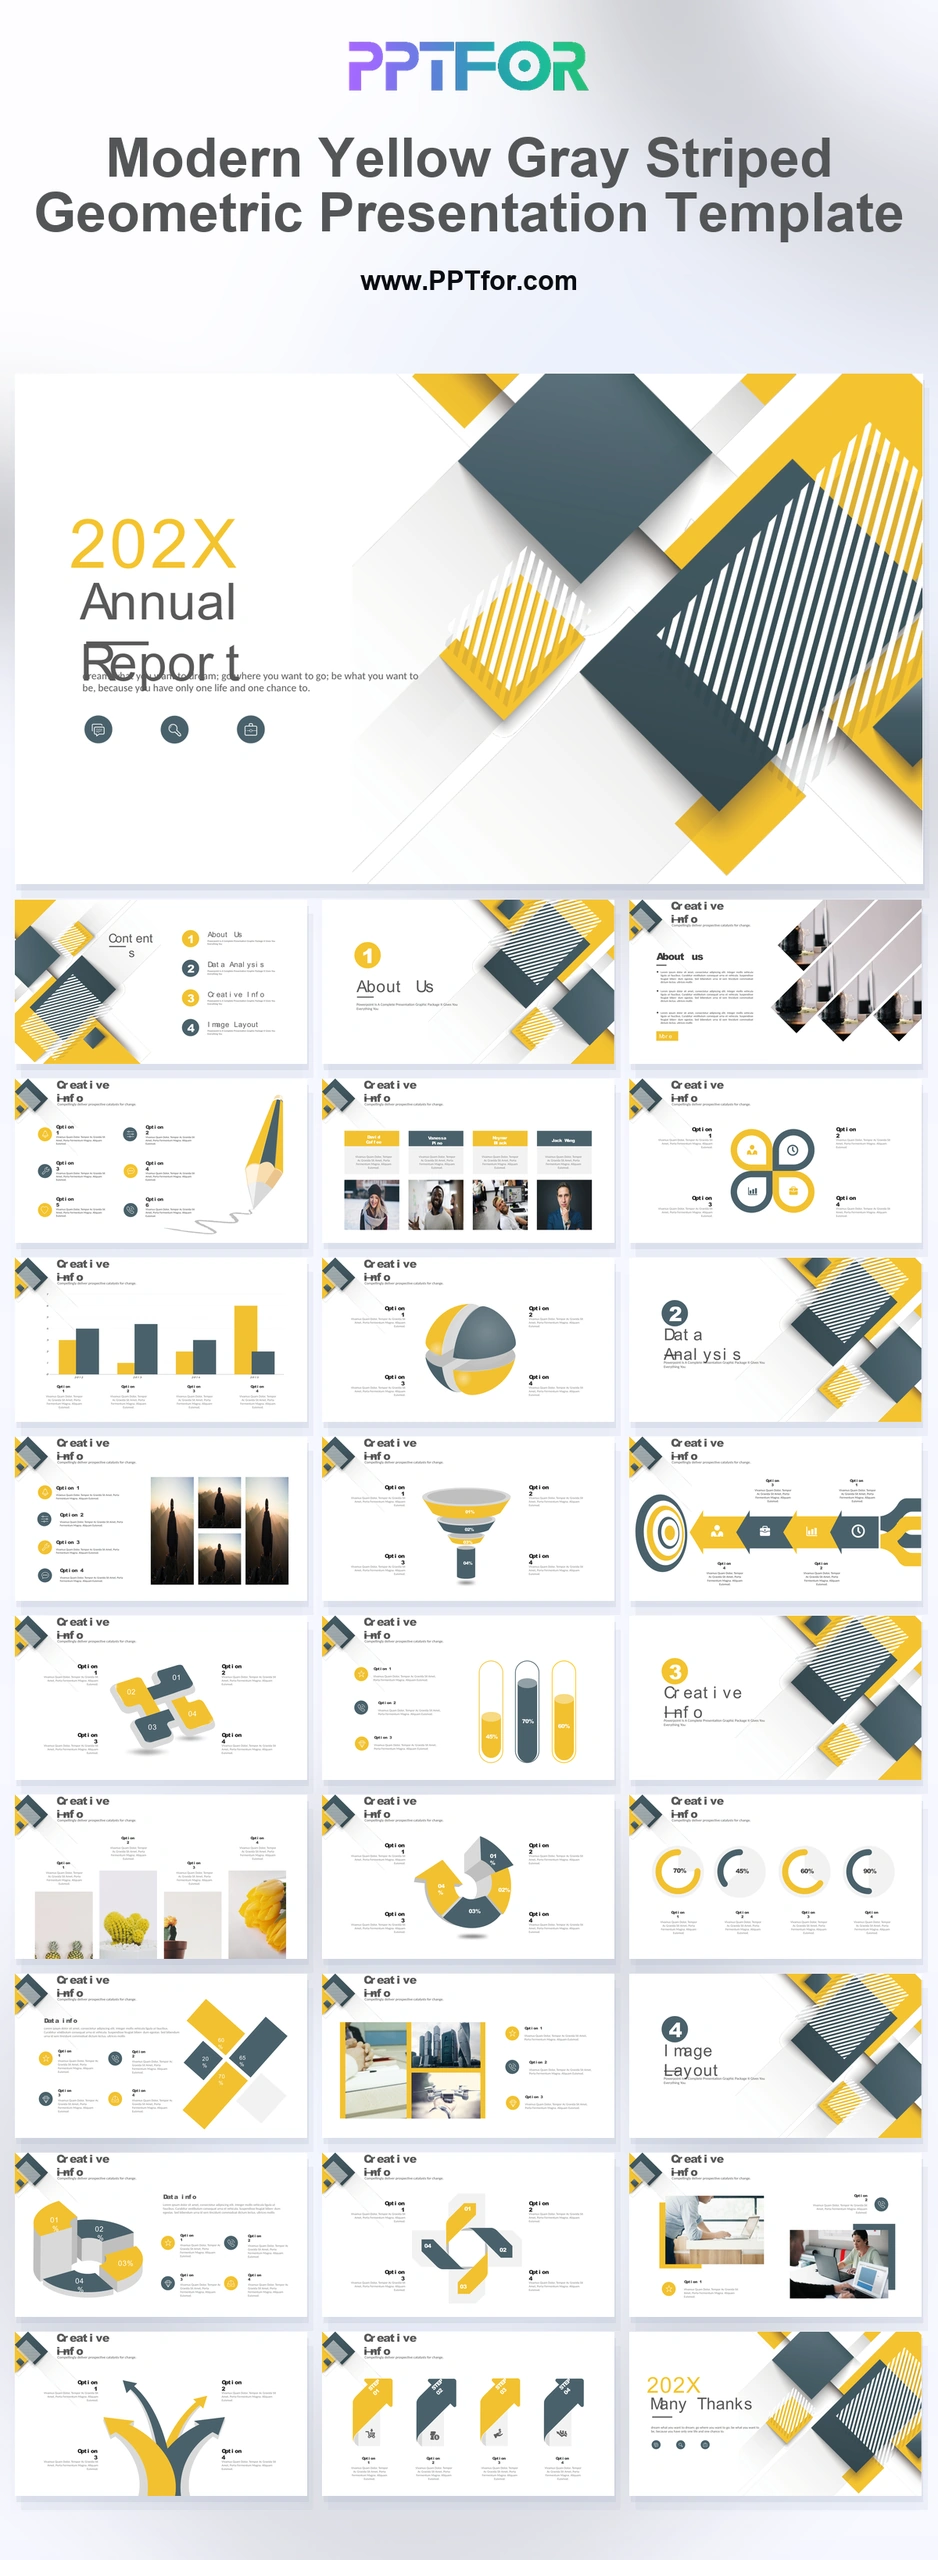
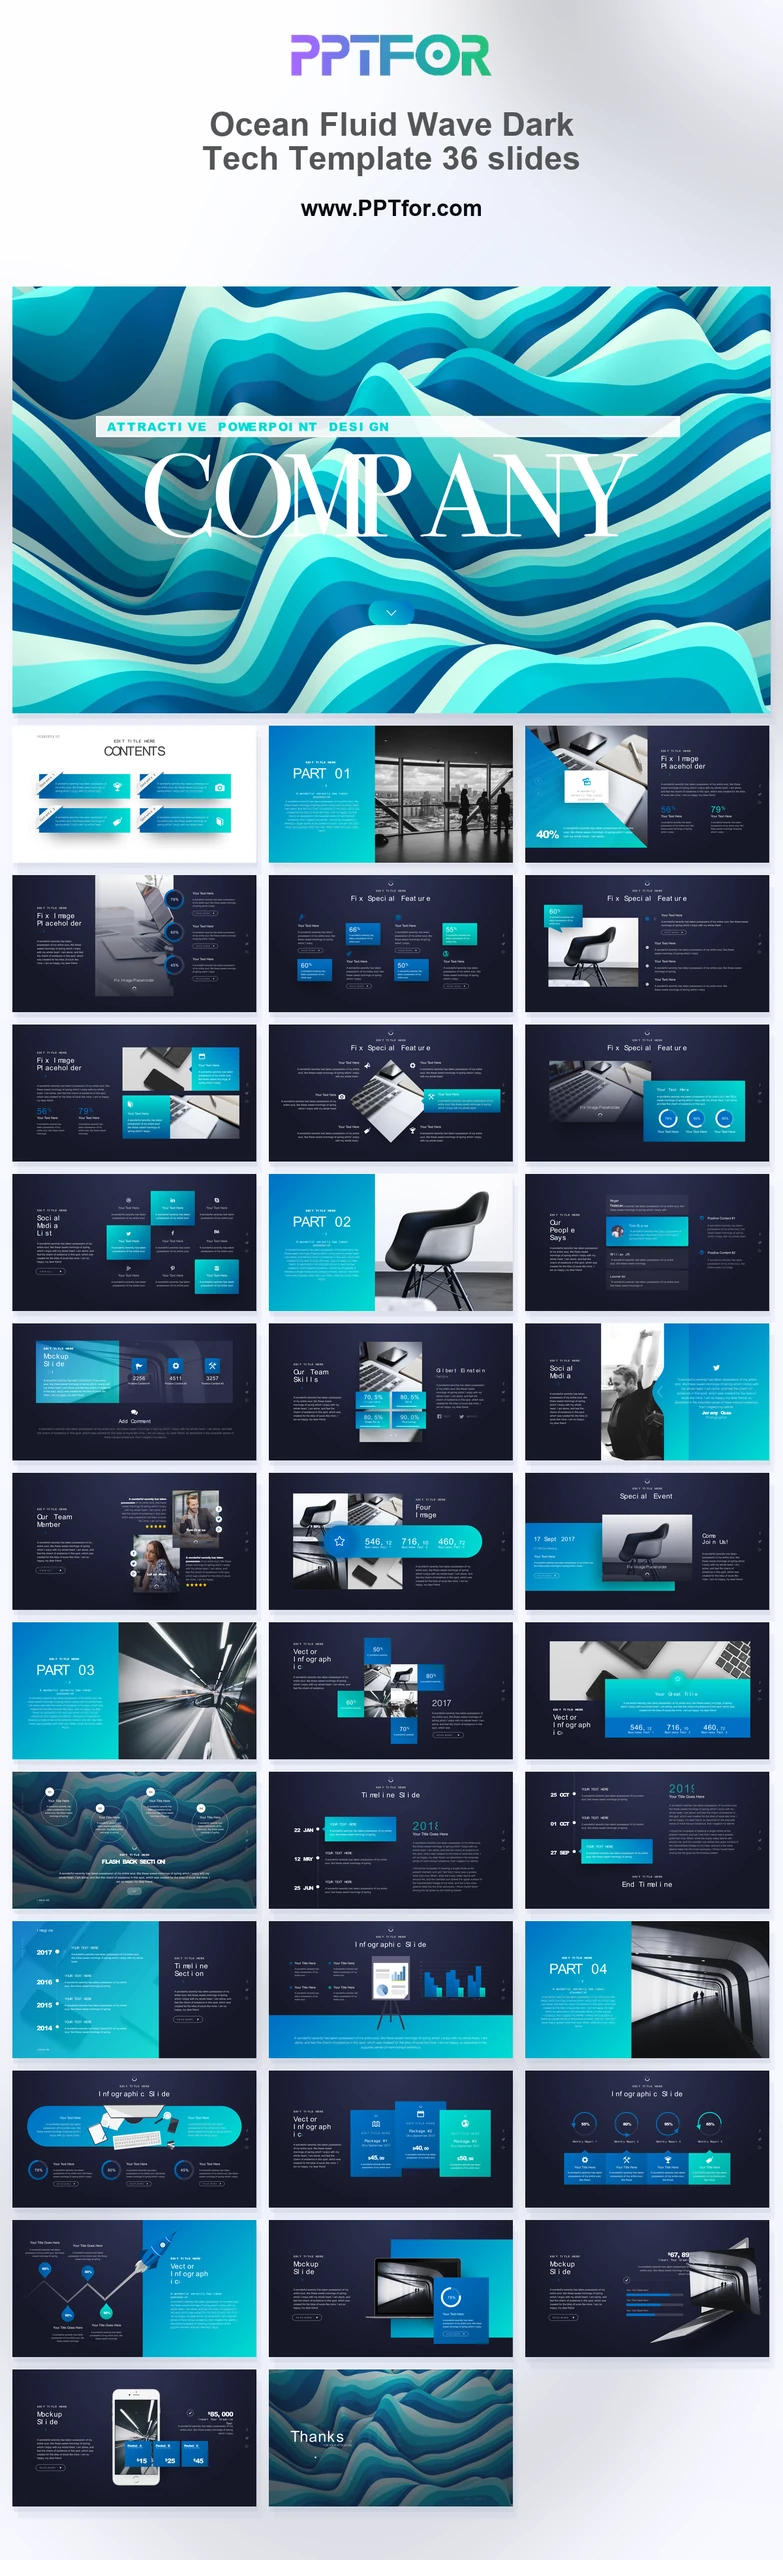
Use this Ultimate Business Charts and Creative Infographics Data Pack for reporting, milestone visuals, workflow maps, and research data in 48 slides.
The Ultimate Business Charts and Creative Infographics Data Pack gives business analysts, project managers, marketing consultants, HR specialists, and operations leads a 48-slide resource for data-driven business reporting, project milestone visualization, strategic workflow mapping, core competency analysis, and market research data representation. Playful business cartoon characters, 3D layered step blocks, jigsaw puzzles, geometric shield grids, lightbulb nodes, chevron pipelines, and profile head analytics create a metric-focused illustrative system for digital marketing agencies, enterprise consulting, management training, startup incubators, data analysis firms, and corporate HR teams. This template supports data-driven insights through bar charts, timeline roadmaps, growth ladders, protection shields, flow loops, puzzle correlation charts, risk umbrella layouts, asset packages, segmented pyramids, competency arrows, logic analytics, hexagonal networks, and service grids. Template compatibility includes Microsoft PowerPoint, Google Slides, and Apple Keynote, with editable vector shapes, illustration nodes, drag-and-drop placeholders, and customizable slides, colors, fonts, and layouts. Customize this pack now and turn complex metrics into clearer presentation-ready business visuals.
This data pack is best used for business reporting, project milestone visualization, workflow mapping, competency analysis, and market research presentations that need charts, diagrams, and illustrative business concepts.
Business analysts, project managers, marketing consultants, HR specialists, operations leads, startup incubators, data analysis firms, and enterprise consulting teams can use it to present metrics, process logic, and strategic findings.
The deck includes performance bar charts, roadmap pipelines, brainstorming lightbulbs, growth step ladders, shield grids, chevron loops, jigsaw correlation charts, umbrella risk layouts, segmented pyramids, competency arrows, logic analytics, hexagonal networks, and service grids.
Yes. The template works with Microsoft PowerPoint, Google Slides, and Apple Keynote, with 100% vector graphics, editable illustration nodes, drag-and-drop placeholders, rapid color palette switching, and customizable slides, colors, fonts, and layouts.

Get full access to our entire collection of premium PPT templates for one simple price.
Forget about complex tools or technical skills—just choose, edit, and download.