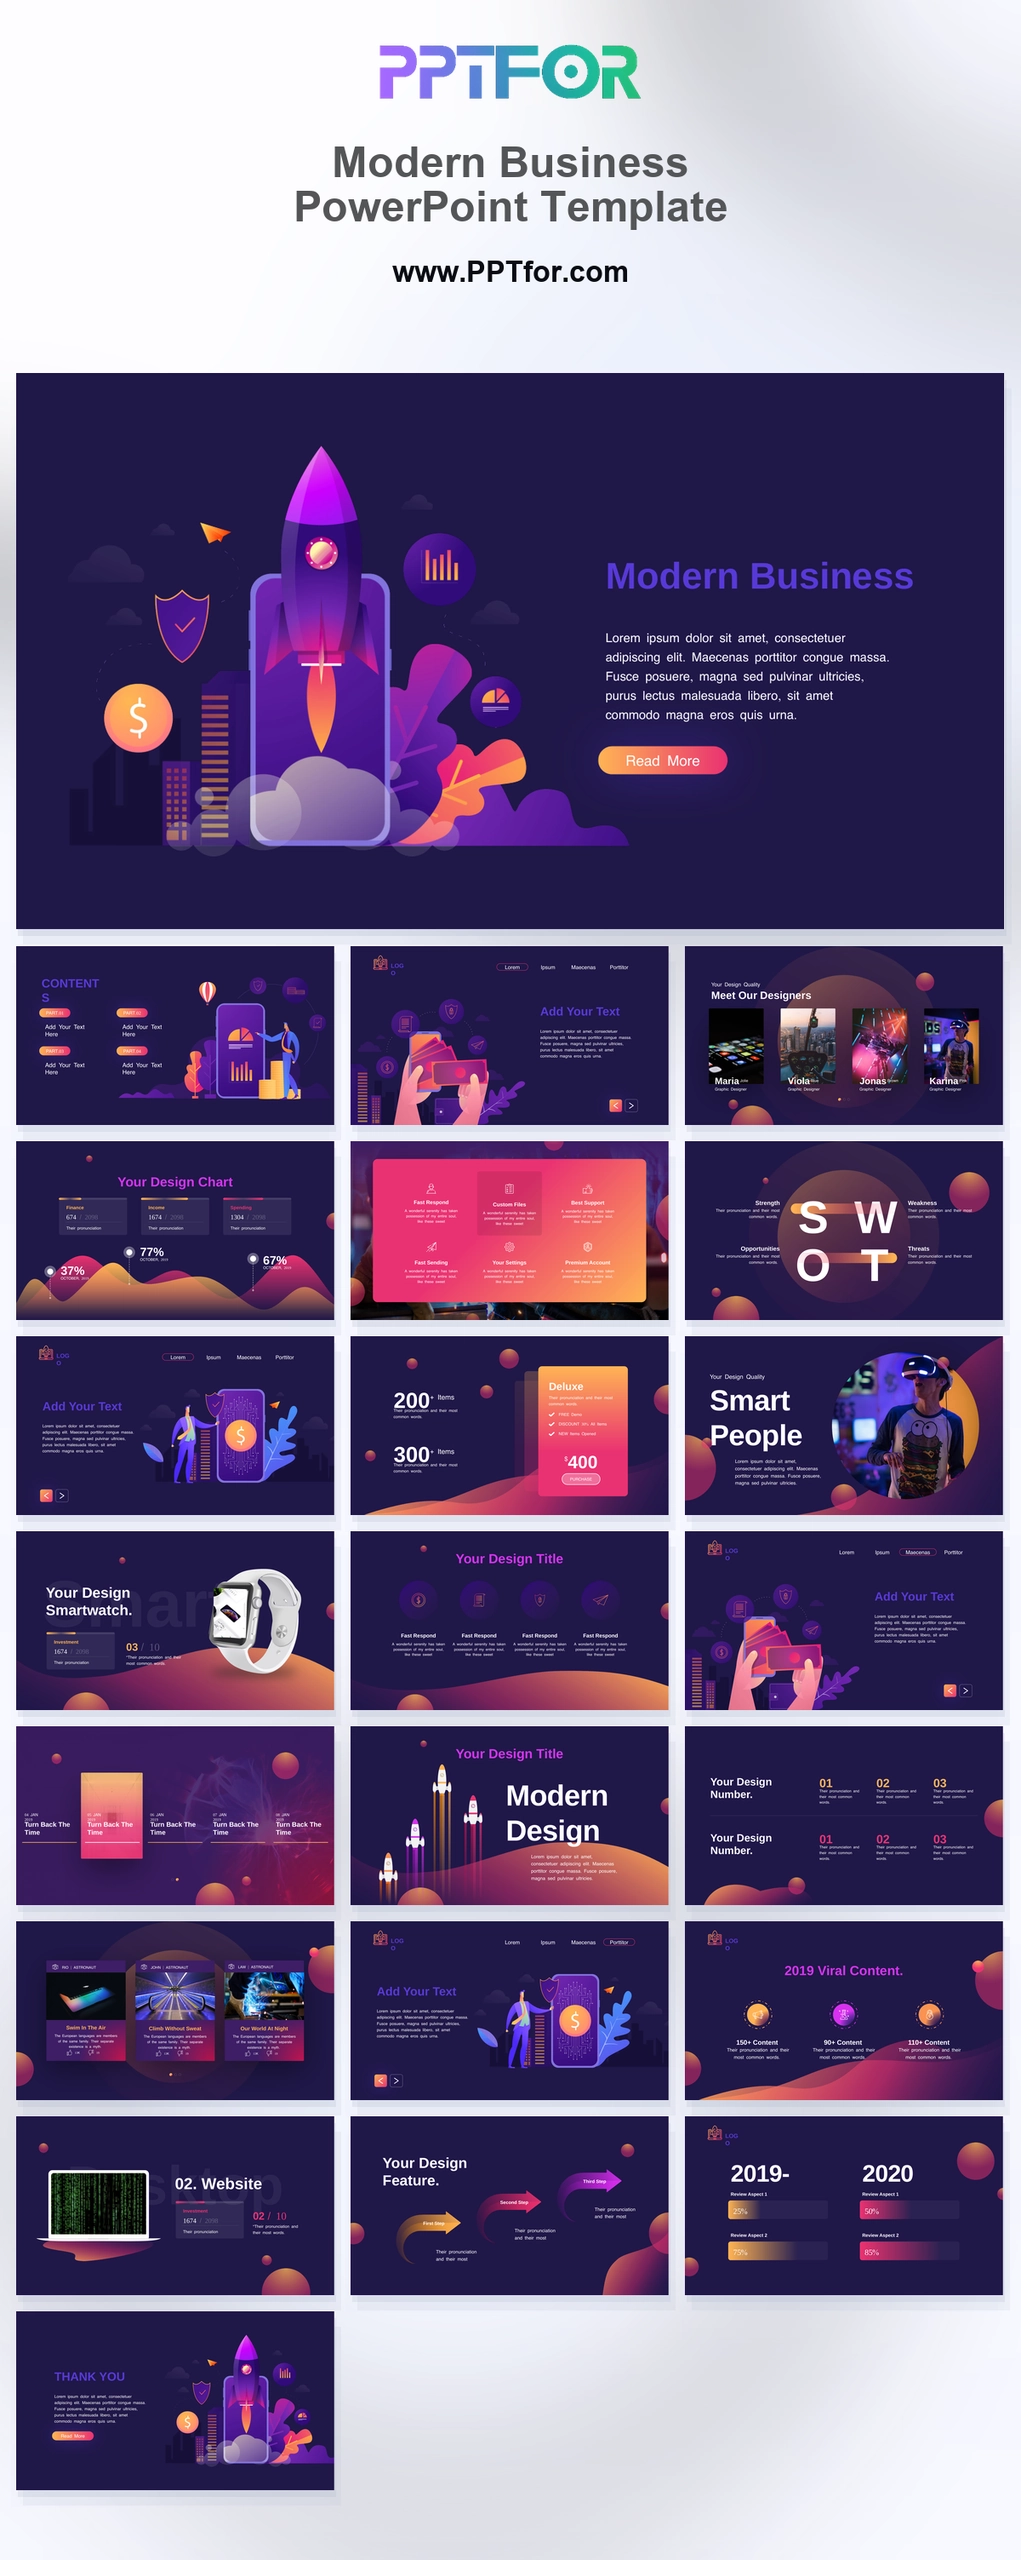
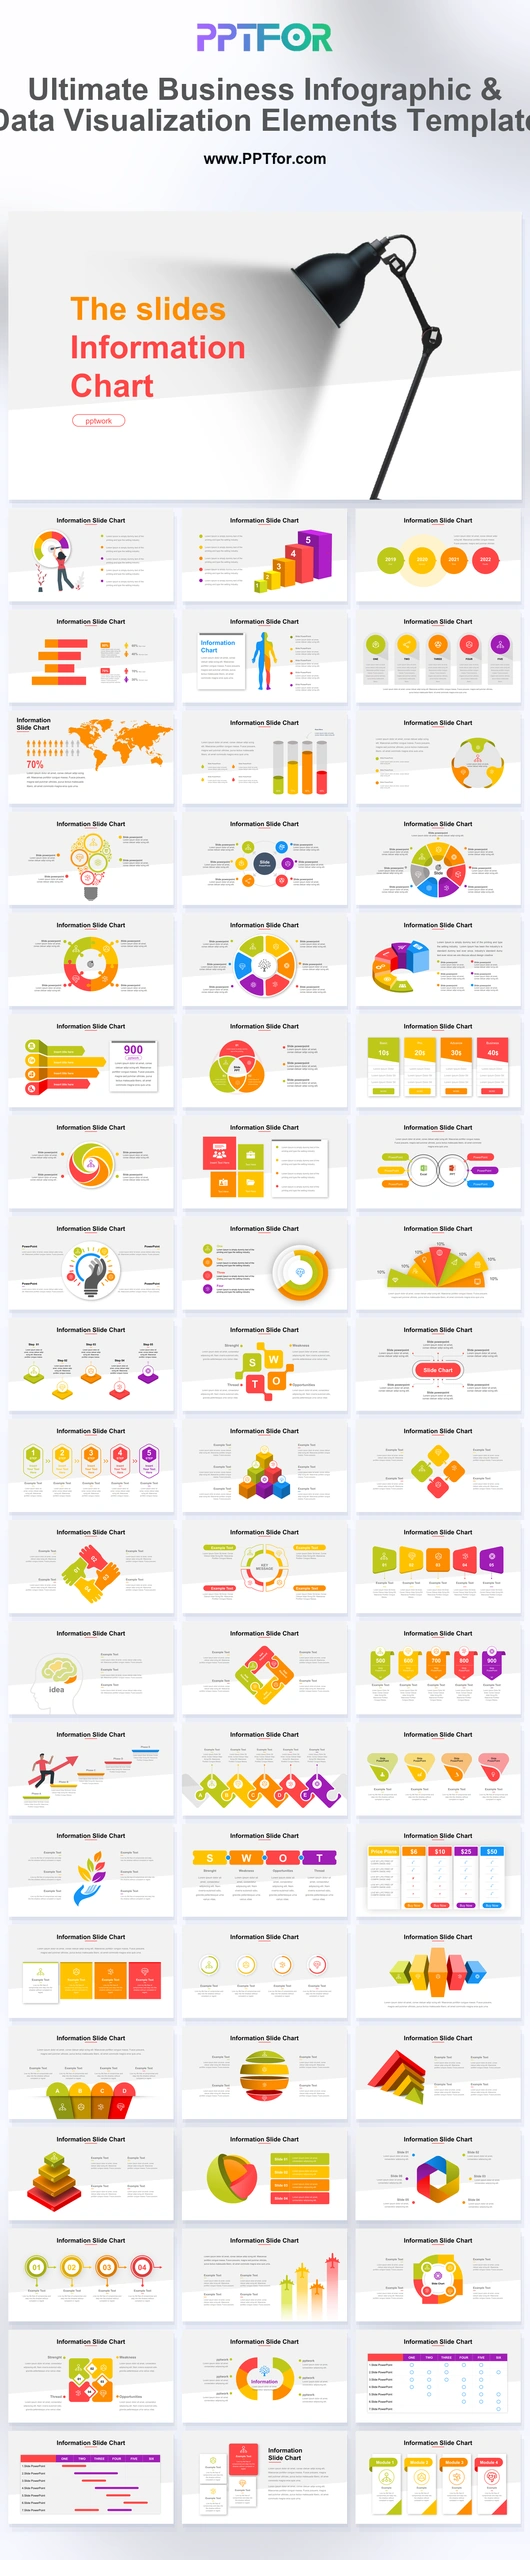
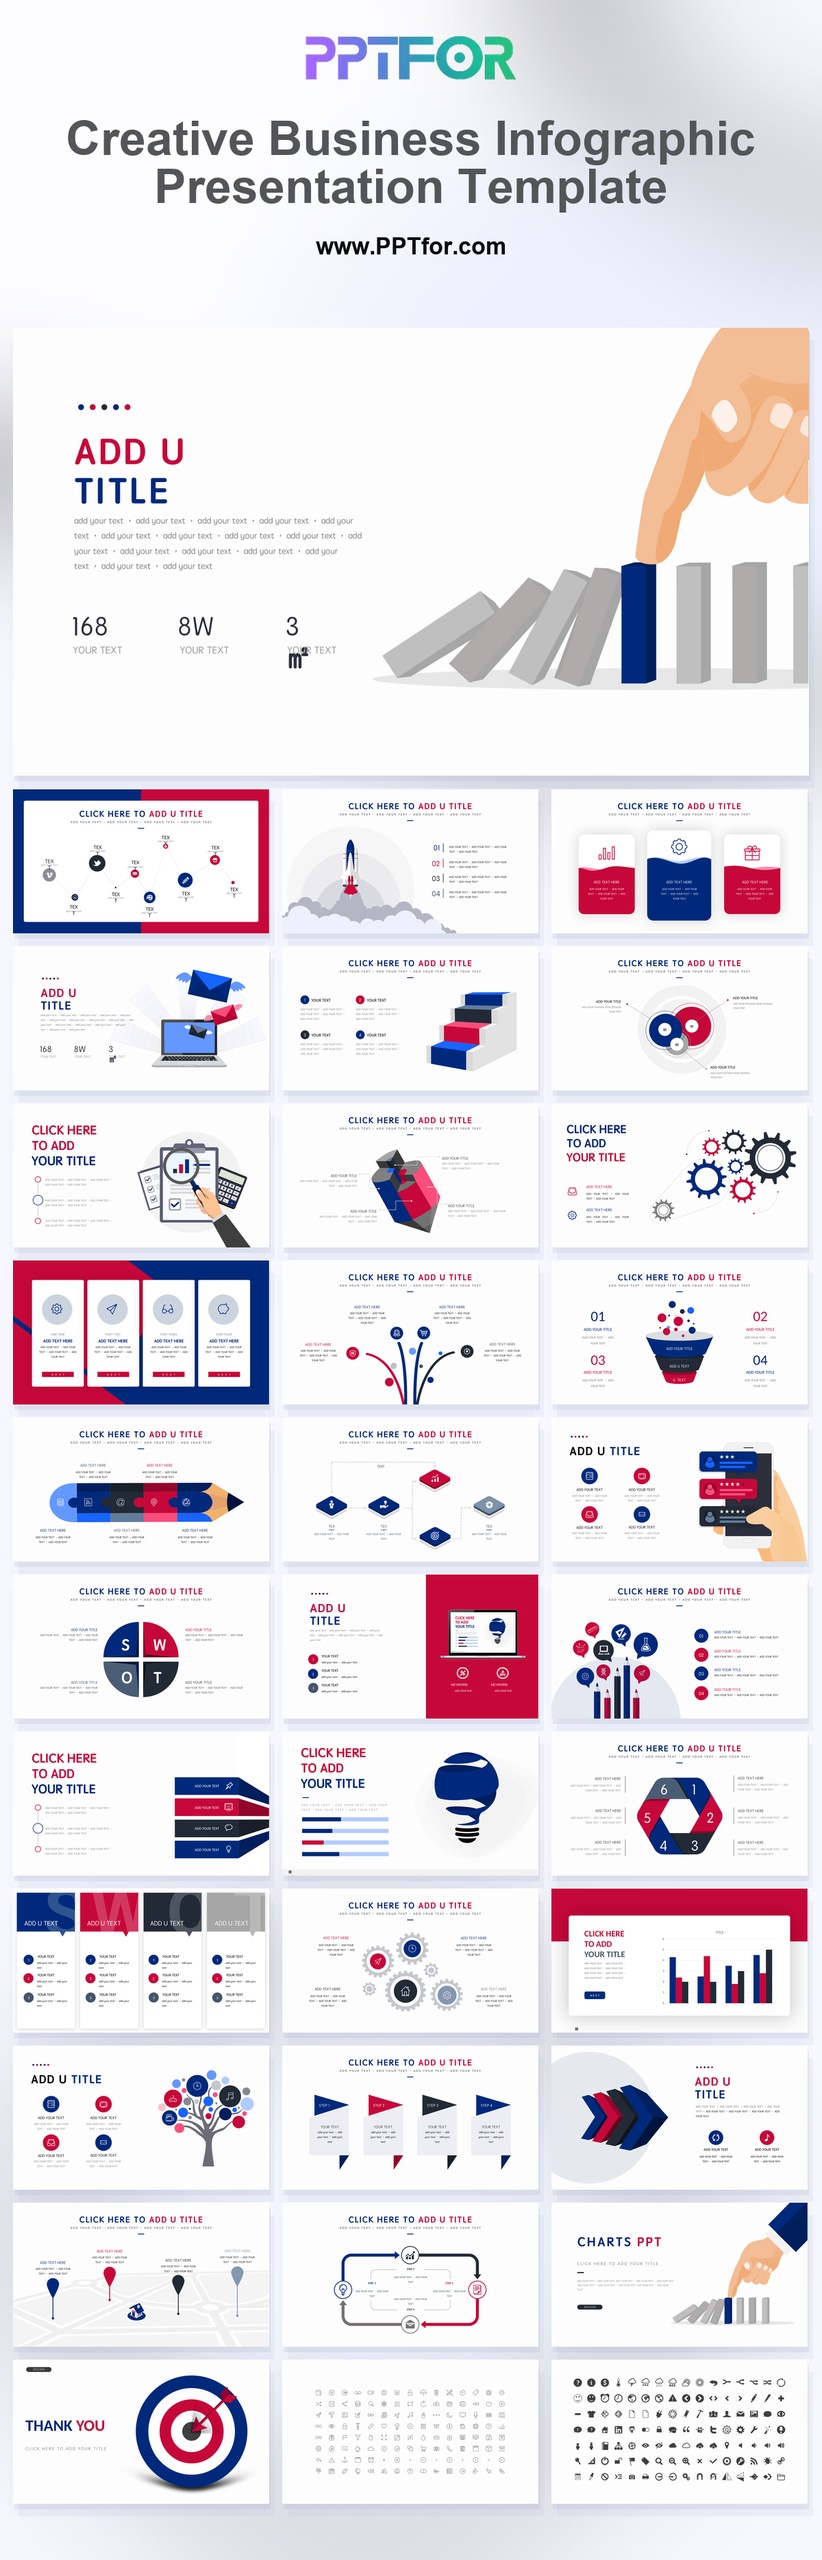
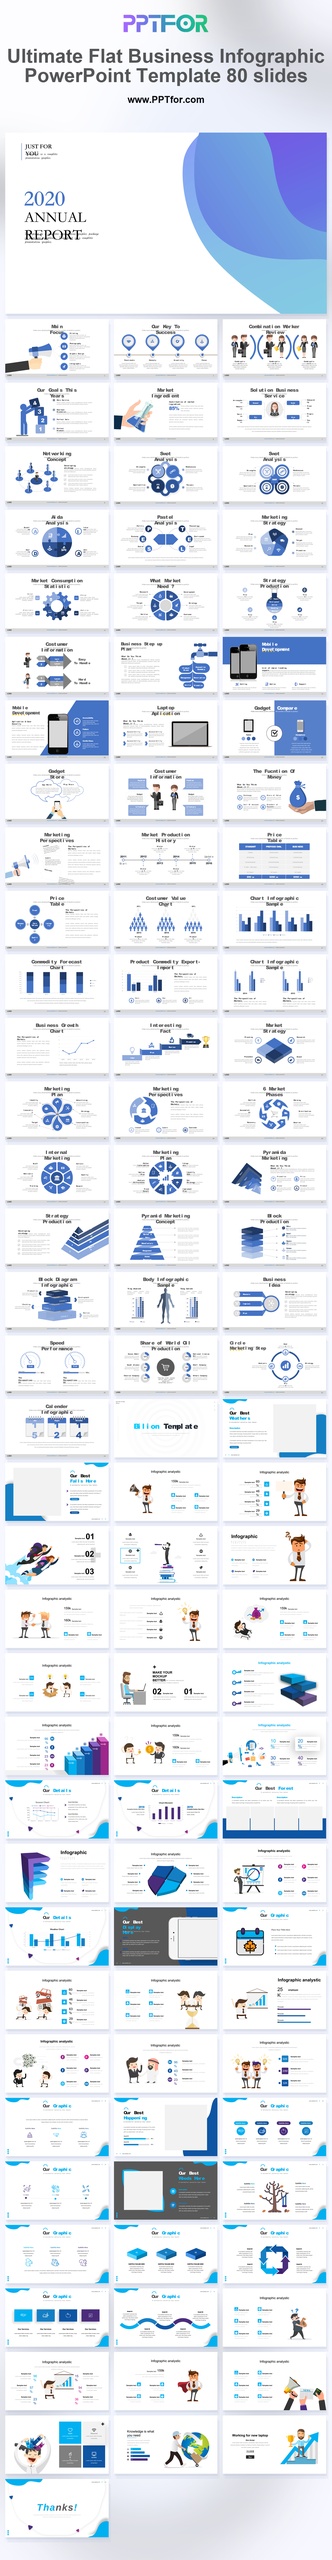
Business infographic templates help analysts, consultants, trainers, and project teams explain complex ideas, metrics, workflows, and comparisons through structured visual slides.This business infographic template collection gives buyers a broad library of presentation templates for turning data, strategy, processes, timelines, competencies, and market findings into easier-to-scan business visuals. Many template options may include charts, diagrams, icons, process flows, SWOT layouts, funnels, roadmaps, and comparison tables, while slide counts, styles, aspect ratios, and feature sets vary by template.
- Compatibility: Commonly supports Microsoft PowerPoint, Google Slides, Apple Keynote
- Aspect Ratios: Often available in 16:9 widescreen
- Graphics: Commonly includes 100% Vector Graphics
- Placeholders: Many templates include Drag-and-Drop Placeholders
- Editability: Commonly features fully customizable slides, colors, fonts, and layouts
- Slide Counts: Slide counts vary by template
What You Can Use Business Infographic Templates For
- Business analysts explaining performance metrics - convert key indicators, trend analysis, and findings into cleaner visual summaries.
- Consultants mapping strategy options - use infographic presentation templates to compare priorities, risks, workflows, and recommendations.
- Project managers tracking milestones - present timelines, task progress, dependencies, and next steps in a format stakeholders can scan quickly.
- Corporate trainers teaching complex processes - break training topics into diagrams, step flows, and icon-supported learning slides.
- Marketing teams reviewing funnel performance - organize conversion funnel insights, campaign stages, and customer acquisition priorities.
- Operations leaders presenting workflow improvements - clarify process changes, bottlenecks, and measurable outcomes for team alignment.
- Startup founders summarizing business models - explain traction, value proposition, market opportunity, and roadmap ideas through compact visuals.
Frequently Asked Questions
What are business infographic templates commonly used for?
This collection is commonly used for data reporting, strategy planning, workflow mapping, training presentations, project updates, market analysis, and executive summaries that need visual explanation rather than text-heavy slides.
Who typically uses business infographic presentation templates?
Business analysts, consultants, project managers, trainers, marketing teams, operations leaders, and startup founders often use these templates to communicate metrics, processes, comparisons, and strategic recommendations.
What kinds of layouts can a business infographic collection include?
Many templates may include charts, process diagrams, funnels, timelines, roadmaps, SWOT layouts, maps, icons, comparison tables, and data visualization slides, though exact layouts and included features vary by template.
How does this collection help teams choose presentation visuals faster?
This collection helps teams compare business infographic PowerPoint templates by visual style, chart type, and use case, then start from editable diagram structures instead of designing every visual explanation from scratch.
 Get full access to premium PowerPoint templates at a limited-time price.Get Now