Get full access to premium PowerPoint templates at a limited-time price.Get Now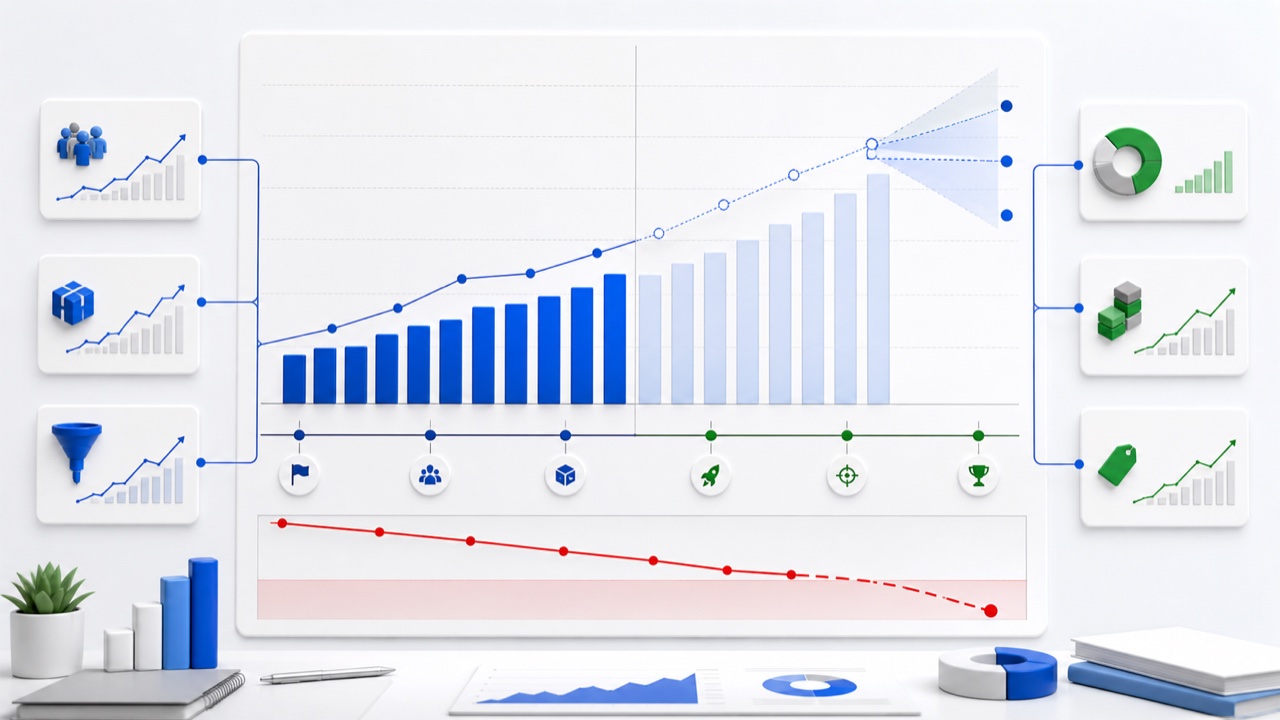
A financial projections slide in a pitch deck should show the economic logic of the startup, not compress the entire spreadsheet model into PowerPoint. Present a small number of decision-relevant outputs, identify the main operating assumptions, and connect the forecast to milestones and funding needs. Investors need to understand how the business could scale and what must be true for the plan to work.
The slide should help an investor answer:
A projection is not proof. Treat it as a transparent operating hypothesis supported by current evidence.
Choose metrics that fit the business and stage. Typical options include:
Do not show every line item from the model. Keep the detailed income statement, cash flow, cohort analysis, and scenario logic in an appendix or separate financial model.
State the economic message, such as “Enterprise expansion and improving gross margin support a path to break-even.” Avoid claiming certainty.
Use a line or column chart for three to five periods. Clearly label actual and forecast years. A divider or background change can prevent the audience from treating projections as historical results.
List three to five drivers, such as customer acquisition, pricing, retention, utilization, gross margin, hiring, or sales productivity.
Show how the raise supports specific milestones and how long the capital is expected to last under the base plan.
Identify the assumption that creates the greatest downside. A small scenario range is more credible than false precision.
Use operational relationships instead of arbitrary growth percentages. Examples include:
State which inputs are observed, contracted, benchmarked, or assumed. This helps the investor test the model without reading every formula.
The Startup Financing Modern Corporate Pitch Deck Template includes startup financing layouts. The Investment Pitch Decks Business PowerPoint Template supports a complete investor narrative, while the Vibrant Red Fintech Business PowerPoint Template suits finance-oriented presentations.
Use the template for hierarchy and consistency, then replace every sample value with verified figures from the financial model.
Small tables cannot be read during a presentation. Summarize the economic story and provide full statements separately.
A chart that rises smoothly does not explain how growth occurs. Tie revenue to customers, capacity, pricing, usage, or transactions.
Label periods explicitly and visually distinguish them. Investors should never have to guess which numbers have already occurred.
Profitability and liquidity are different. Include burn, ending cash, or runway when cash determines the funding requirement.
Long-range startup forecasts are uncertain. Round appropriately and show key assumptions or scenarios instead of implying exact outcomes.
Explain what the capital enables and what evidence the company expects to create before the next financing decision.
Create a simple control table outside the presentation that maps every number on the slide to a model output and model version. Confirm the same currency, period, accounting treatment, and scenario are used throughout. If the forecast changes during fundraising, update the slide and appendix together.
Test the story against the model. If the deck says gross margin improves because of scale, the cost assumptions should show that relationship. If hiring drives growth, the timing of recruitment, productivity, and cash use should be visible. Contradictions between the narrative and model create more concern than a conservative forecast.
For the full investor narrative, see Startup Pitch Deck: Slides, Structure, and Investor Tips. For market sizing assumptions, use How to Present Market Size in a Startup Pitch Deck.
Three to five years is common, but the useful horizon depends on the business stage and model. Near-term assumptions should be more detailed than distant estimates.
They can show a milestone-based operating plan, cost structure, cash need, and explicit assumptions. Avoid presenting unsupported precision as evidence.
Show the measures that explain economics and funding. For many early-stage companies, gross margin, operating burn, ending cash, and runway are more decision-relevant than accounting profit alone.
Place the most important drivers on the main slide and provide detailed assumptions, scenarios, and statements in the appendix or financial model.
Get full access to our entire collection of premium PPT templates for one simple price.
Forget about complex tools or technical skills—just choose, edit, and download.