 Get full access to premium PowerPoint templates at a limited-time price.Get Now
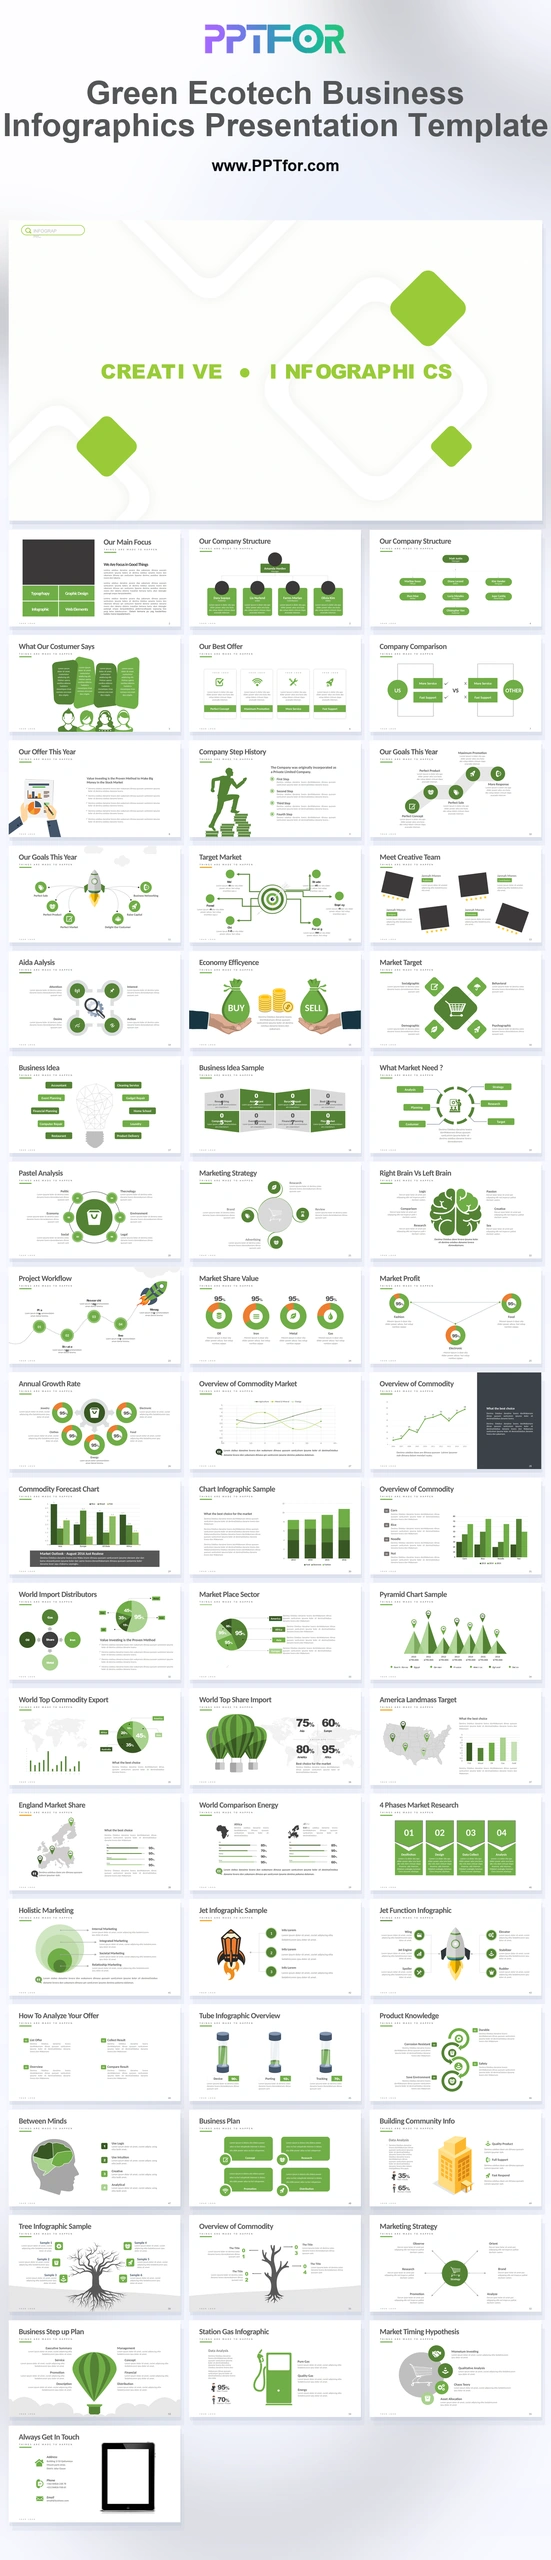
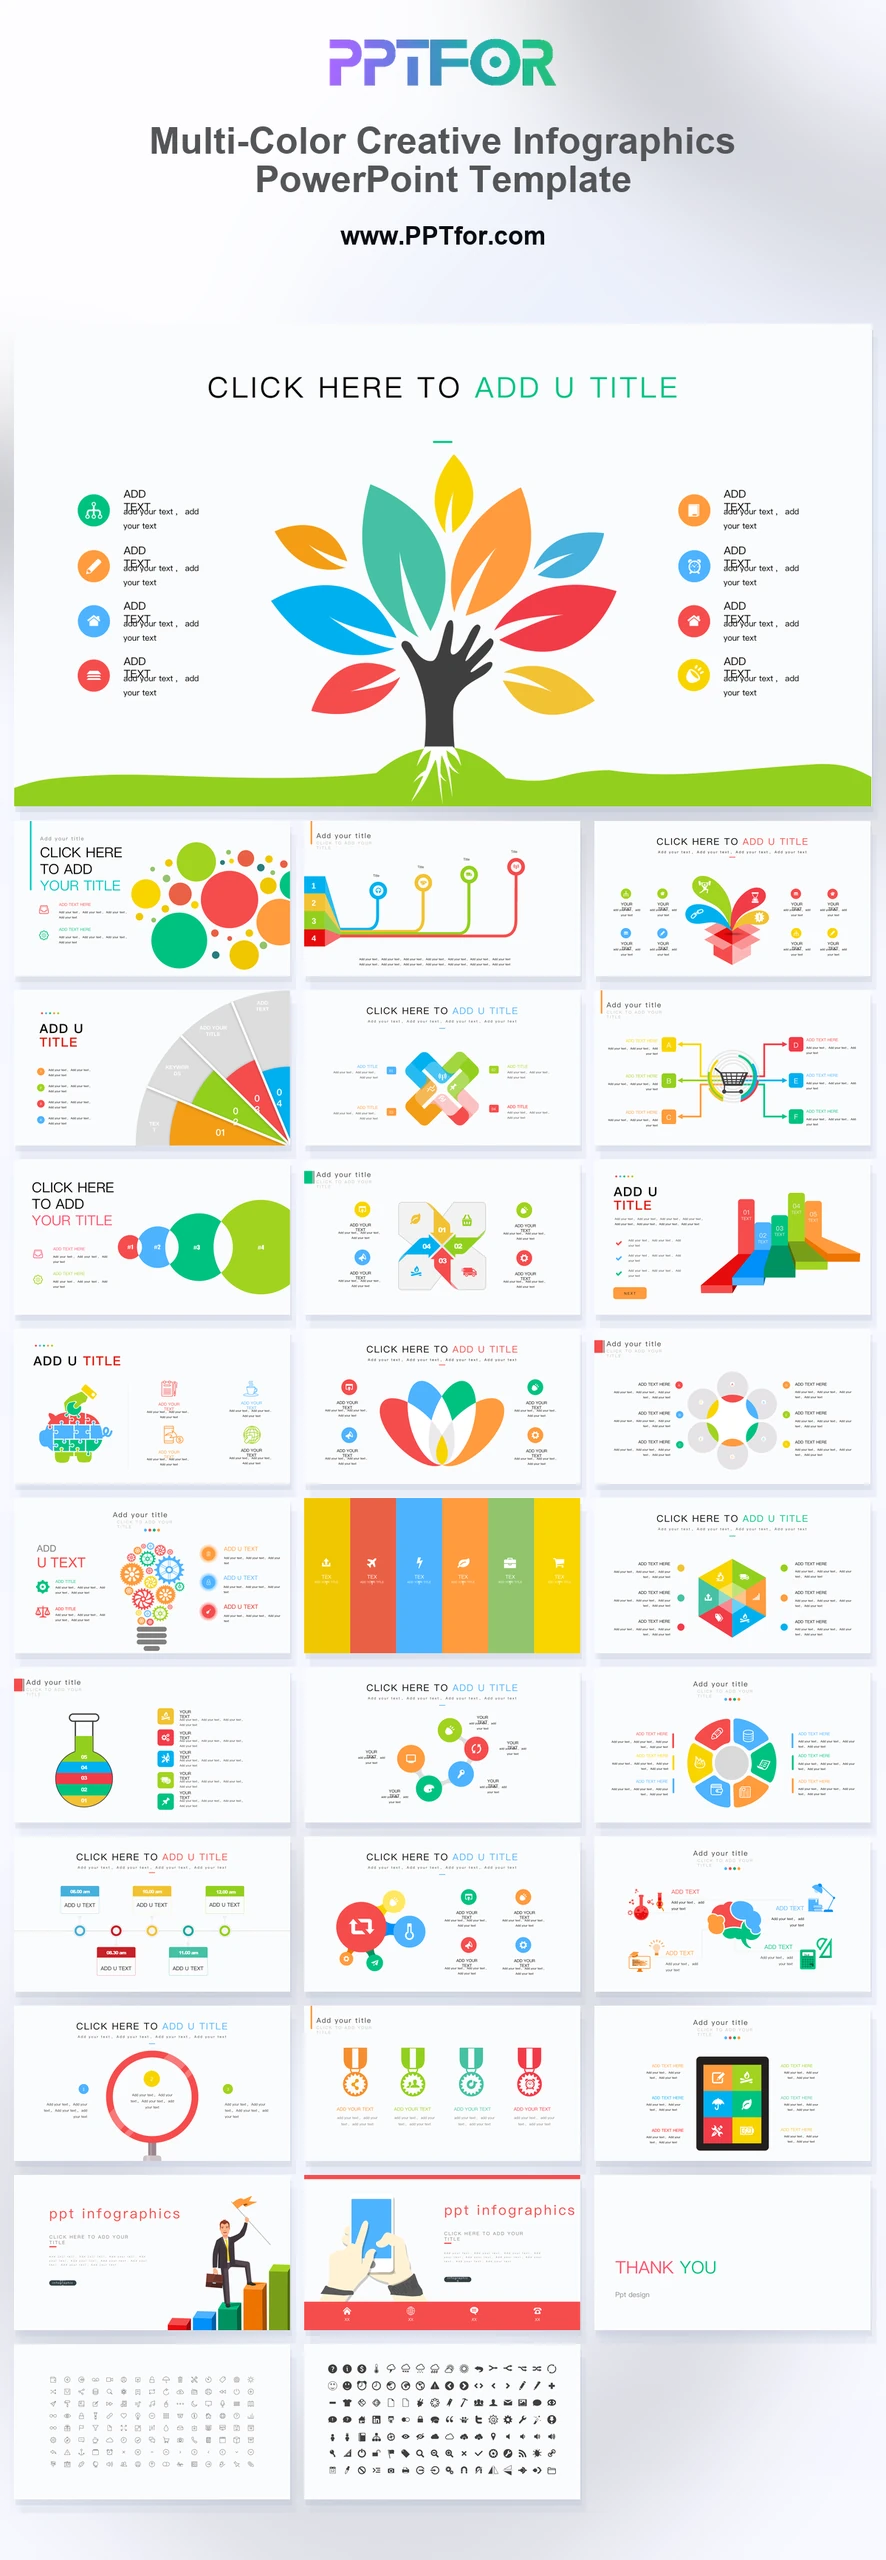
Use this Creative Green Ecotech Business Infographics Template to present sustainability reports, market analysis, and risk reviews in 54 slides.
The Creative Green Ecotech and Business Infographics Presentation Template gives business strategists, project managers, environmental consultants, financial analysts, and marketing leads a 54-slide deck for business development plans, sustainability reporting, market share analysis, investment risk evaluation, and workflow mapping. Rounded diamond framing, green icons, line graphs, brain analysis maps, rocket growth vectors, step-up funnels, and tree root corporate structures create a minimalist canvas for narrative-driven metrics. The Eco Green, Moss Green, Charcoal Gray, and Off-White palette supports growth, balance, sustainability, and structured review across organizational trees, customer profiles, commodity forecast charts, target markets, team grids, risk funnels, brain logic layouts, timelines, pricing tables, heatmaps, SWOT matrices, dashboard gauges, and eco hot air balloon concepts. Template compatibility includes Microsoft PowerPoint, Google Slides, and Apple Keynote, with editable vector shapes, rapid brand color adaptation, and data-centric layouts built for focused analysis. Customize this deck now and turn your next sustainability or market report into a clearer business development story.
This template is best used for business development plans, sustainability reporting, market share analysis, investment risk evaluation, and project workflow mapping across green energy, finance, agtech, consulting, and research contexts.
Business strategists, project managers, environmental consultants, financial analysts, marketing leads, commodity teams, and green energy consultants can use this deck to present metrics, forecasts, risk reviews, workflows, and market findings.
The deck includes organizational structure trees, customer profiles, commodity forecast charts, goal rockets, target bullseyes, team grids, risk funnels, brain logic layouts, timelines, pricing tables, heatmaps, SWOT matrices, dashboard gauges, and eco hot air balloon concepts.
This template works with Microsoft PowerPoint, Google Slides, and Apple Keynote. Editable vector shapes, rapid brand color adaptation, minimalist canvas layouts, and data-centric infographic sections help teams adapt all 54 slides efficiently.

Get full access to our entire collection of premium PPT templates for one simple price.
Forget about complex tools or technical skills—just choose, edit, and download.