An annual report is one of the most important documents your finance team produces each year. It tells leadership, board members, and investors how the company performed, where it’s heading, and what risks and opportunities lie ahead. A strong PowerPoint template can help you turn complex financial data into a clear, confident presentation.
In this guide, you’ll learn:
- Why finance teams need a structured annual report deck
- What core sections every annual report slide deck should include
- How to choose the right PowerPoint design style for executives
- Common mistakes to avoid in financial report slides
- How to turn your template into a polished, presentation‑ready file
If you already have a template, you can skip to the end for a quick annual report template checklist you can use before your next presentation.
Why Finance Teams Need a Structured Annual Report Deck
Finance teams often manage large datasets, multiple departments, and competing narratives. Without a clear structure, your presentation risks becoming:
- Too detailed for the audience
- Too scattered across topics
- Too hard to follow in a single sitting
A structured annual report deck helps you:
- Tell a story, not just show numbers
- Focus on key takeaways for executives
- Keep slides consistent across months and years
A good template, like the annual report‑style templates in the PPTFOR downloads library, can give you this structure out of the box, so you spend less time designing and more time refining your message.
🔗 You can explore more business report templates in the PPTFOR downloads section.
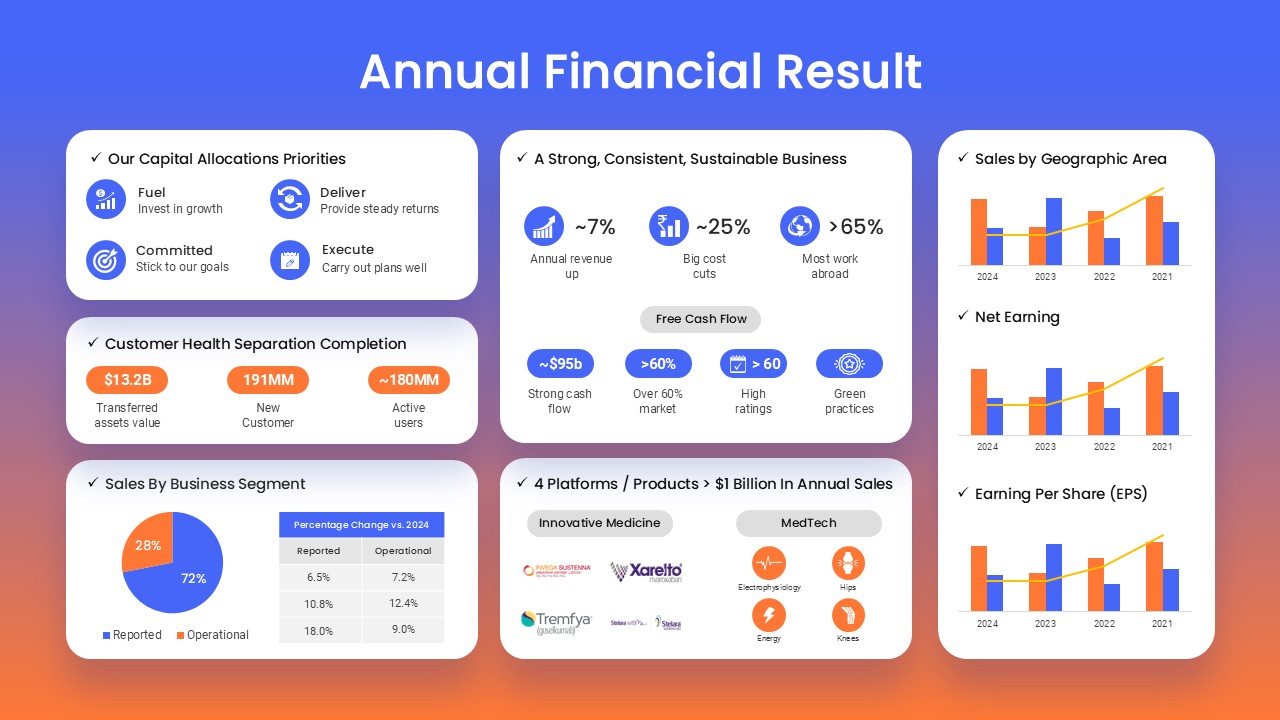
Core Slides Every Annual Report Should Include
Even if your company adds its own sections, most finance teams benefit from including these core slides:
1. Title Slide
- Company name
- “Annual Report 2026”
- Preparation date
- Prepared by (team/department)
Keep the layout clean and aligned with your brand guidelines.
2. Executive Summary
- Overall performance in one slide
- Key achievements
- Top risks or challenges
- Next‑year priorities
Use charts and short bullets; avoid long paragraphs.
3. Financial Highlights
- Revenue, EBITDA, net profit, and other key metrics
- YoY and QoQ comparisons
- Management commentary
Colour‑code positive vs. negative trends so the audience can see them at a glance.
4. Segment or Business Unit Performance
- Revenue and margin by business unit
- Market share or customer‑count changes
- Strategic wins or losses
Use simple charts instead of tables where possible.
5. Balance Sheet & Cash Flow Snapshot
- Liquidity position
- Debt levels
- Key working‑capital changes
Highlight only the most important figures, not every line item.
6. Risks and Opportunities
- Market, regulatory, or operational risks
- Opportunities for growth or cost savings
- Plans to mitigate key risks
This slide is often under‑designed; invest time in making it visually clear.
7. Strategic Outlook
- Company vision for the next 1–3 years
- Capex or investment plans
- How the finance function will support the strategy
Anchor each point to measurable outcomes.
8. Appendix / Backup Slides
- Detailed tables
- Methodology notes
- Raw data sources
Keep these slides in the deck, but don’t present them unless questions arise.
How to Choose the Right PowerPoint Design Style
Not every template works for every finance audience. When you browse templates in the PPTFOR downloads area, look for these traits:
Match the Audience
- Board members and investors → clean, minimal, high‑contrast
- Internal teams → more detail‑friendly layouts, with extra space for notes
Match the Data Type
- Charts‑heavy → templates with chart placeholders and KPI‑style layouts
- Narrative‑heavy → more text‑focused layouts for storytelling
Match Your Brand
- Use a template that already supports your brand colours and fonts, or one that is easy to edit.
- If your logo is small, avoid crowded title bars.
You don’t need to start from scratch. A template like those in the Business Report Presentations category can be your starting point, then customized for your exact needs.
Common Mistakes in Financial Report Slides
Even with a good template, many finance teams make these mistakes:
1. Too Many Metrics on One Slide
- It’s tempting to show “everything.”
- Instead, pick 3–5 key metrics per slide and drill into the rest in the appendix.
2. Complicated Charts
- Over‑nested bar charts, 3D effects, or tiny legends hurt clarity.
- Use bar charts, line charts, and simple tables where possible.
3. Lack of Colour‑Coding
- Highlight positive and negative trends consistently.
- Use a single colour for “good” changes and a different one for “challenges.”
4. Text‑Heavy Slides
- Long paragraphs are hard to read when projected.
- Replace text with short bullets, labels, and commentary.
5. Inconsistent Layouts
- Each slide using a different structure confuses the audience.
- A template that enforces a consistent layout across pages can fix this quickly.
Templates in the PPTFOR downloads library are designed to avoid these pitfalls by providing ready‑made layouts that separate KPIs, commentary, and data clearly.
How to Turn Your Template into a Final Deck
Once you’ve picked a template, follow these steps:
Step 1: Import Your Data
- Copy and paste your charts and tables from Excel or BI tools.
- Resize them to fit the placeholders so text doesn’t get cut off.
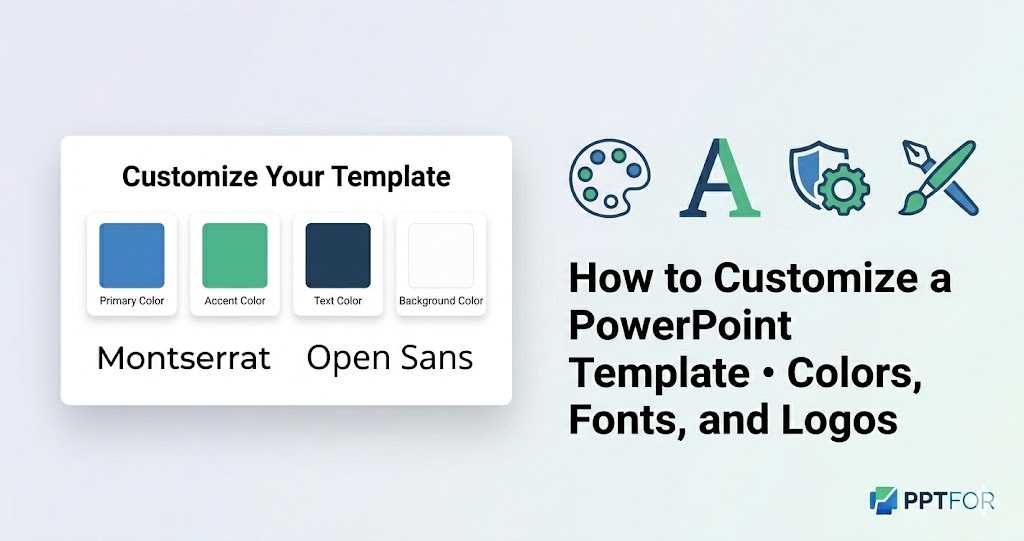
Step 2: Edit Colours and Fonts
- Match your company brand guidelines.
- Use the PowerPoint Template Tutorials section on PPTFOR to learn how to change colours, fonts, and logos efficiently.
Step 3: Add Commentary
- Turn raw numbers into short, plain‑language takeaways.
- For example:
- “Revenue increased by 15%, driven by growth in international markets.”
Step 4: Test the Flow
- Walk through the deck in presenter view.
- Cut any slides that duplicate information or add little value.
Step 5: Export and Share
- Save as
.pptx and .pdf for different use cases. - If your audience will edit the file, keep the template editable and clearly labelled.
Templates in the Business Report Presentations category are already optimized for this workflow, so you can reuse them across quarters and years.
Annual Report Template Checklist
Before you present your annual report, use this checklist:
- [ ] Title slide includes your company name, year, and team
- [ ] Executive summary focuses on 3–5 key messages
- [ ] Financial highlights use clear charts and simple metrics
- [ ] Data is consistent with source files
- [ ] Colours match brand guidelines
- [ ] Spelling and numbers are proofread
- [ ] All slides maintain a consistent layout
When you start with a well‑designed template from the PPTFOR downloads library, you can complete this checklist faster and still deliver a professional, confident presentation.
 Get full access to premium PowerPoint templates at a limited-time price.Get Now