Get full access to premium PowerPoint templates at a limited-time price.Get Now
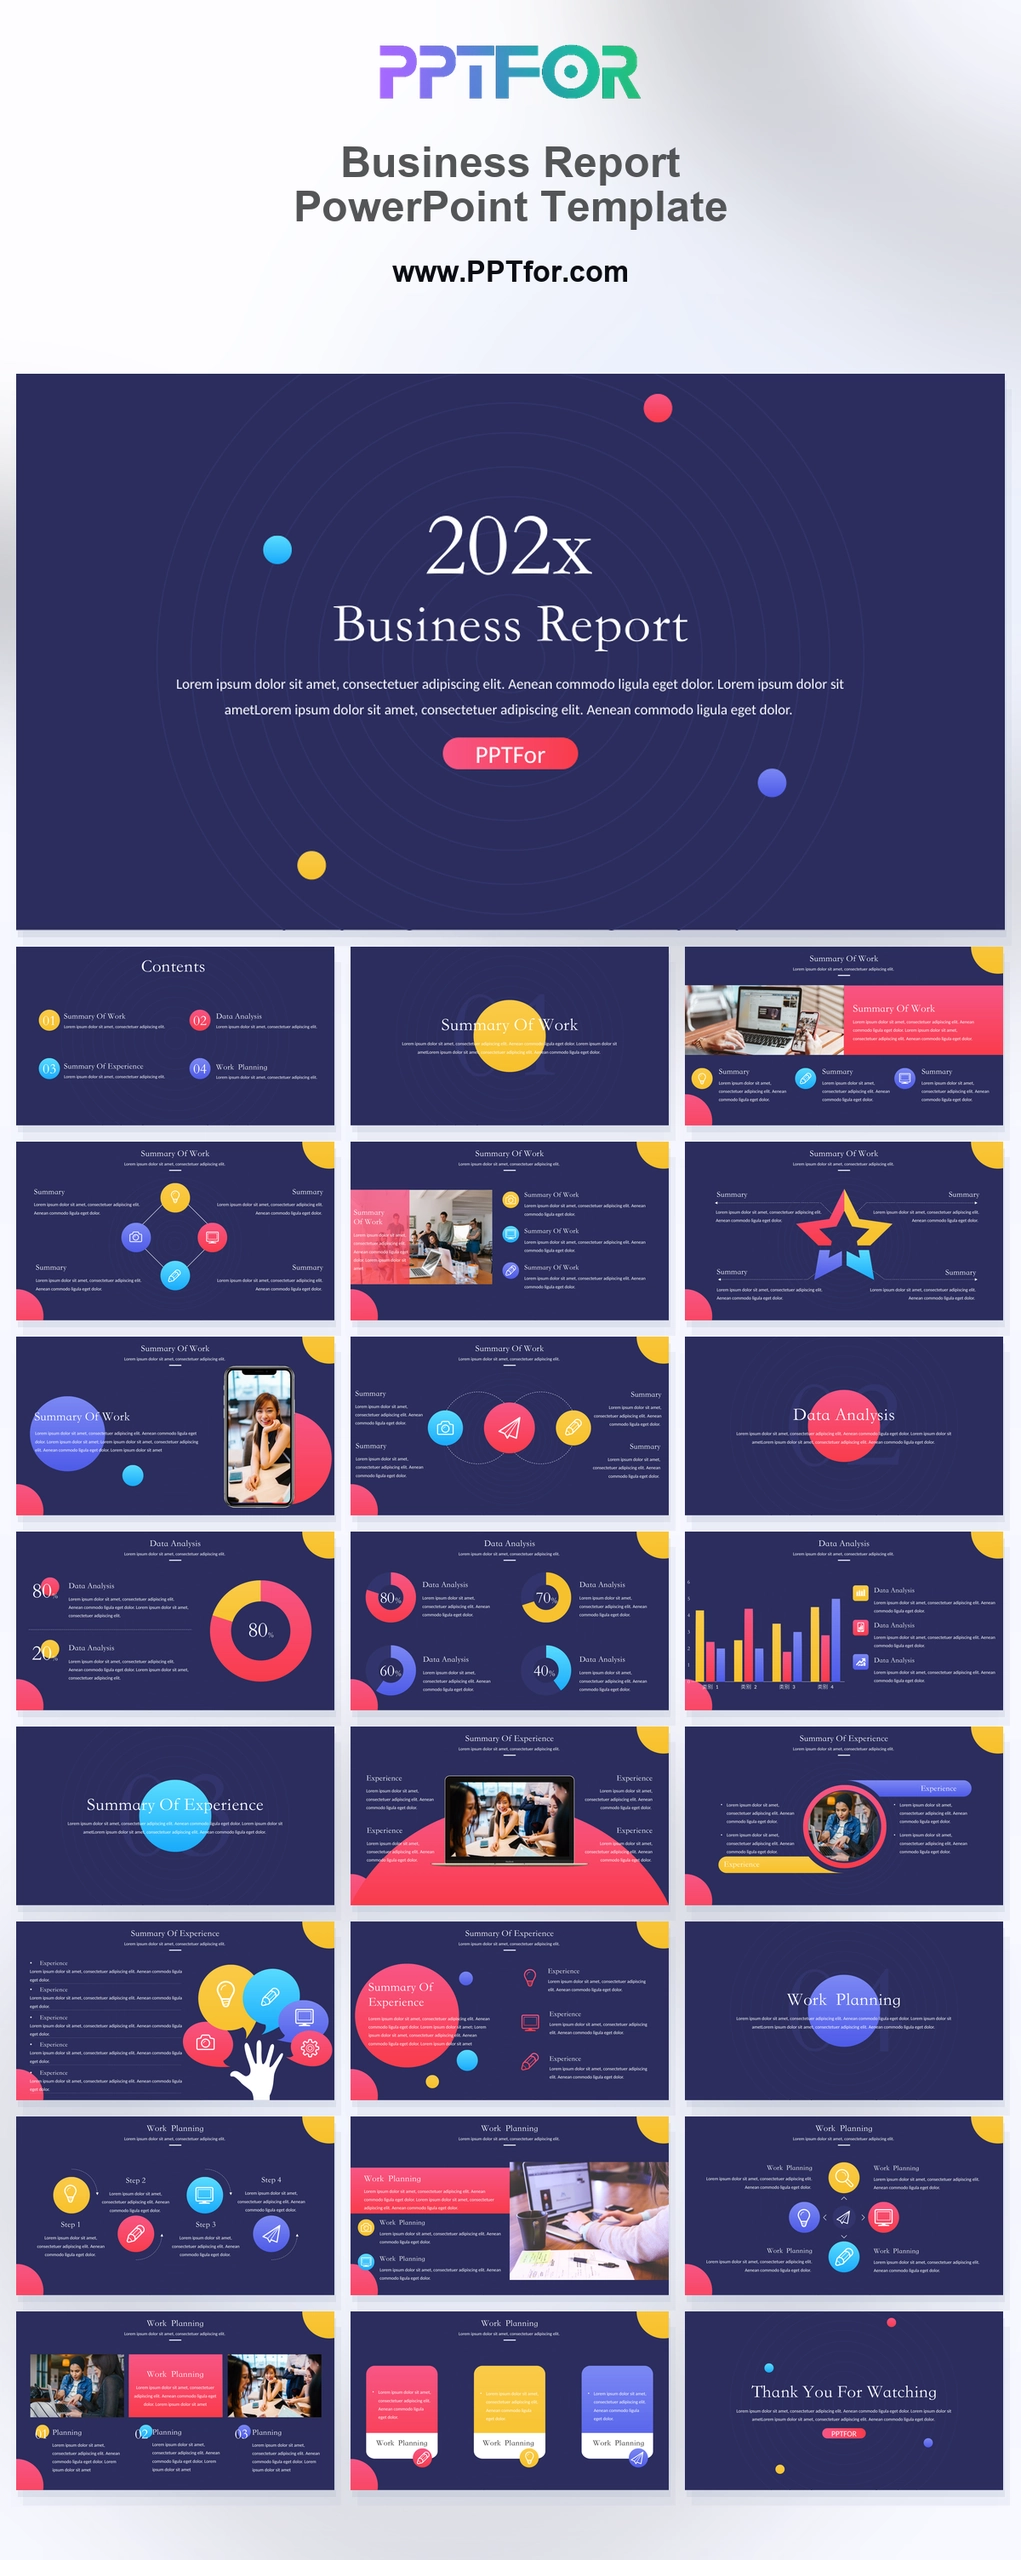
The Business Report PowerPoint Template provides 25 slides with a dark navy background and colorful accents. Work-summary, data-analysis, experience-summary, and work-planning sections provide a sequence for a team or management review.
Choose this version when a report needs to connect completed work with lessons and the next plan. Keep each section focused on a different question so the summary and analysis do not repeat each other.
Prepare completed tasks, measured results, comparison periods, lessons, and next-period actions. Assign owners and dates to the plan, and separate achieved outcomes from work still in progress.
Use the work summary for completed activity, data analysis for measured results, experience summary for lessons, and work planning for the next actions. This gives each section a distinct role.
The preview includes donut charts, circular progress charts, percentage callouts, and a bar chart slide. These layouts are useful for showing business metrics and comparison data.
Duplicate the completed report, update the reporting dates, and replace the figures while keeping metric definitions and chart scales consistent. Carry forward open actions with their owners and revised status.
The design uses a dark navy background with bright color accents, rounded shapes, and clean corporate typography. It feels modern, structured, and more colorful than a plain business report.

Get full access to our entire collection of premium PPT templates for one simple price.
Forget about complex tools or technical skills—just choose, edit, and download.