 Get full access to premium PowerPoint templates at a limited-time price.Get Now
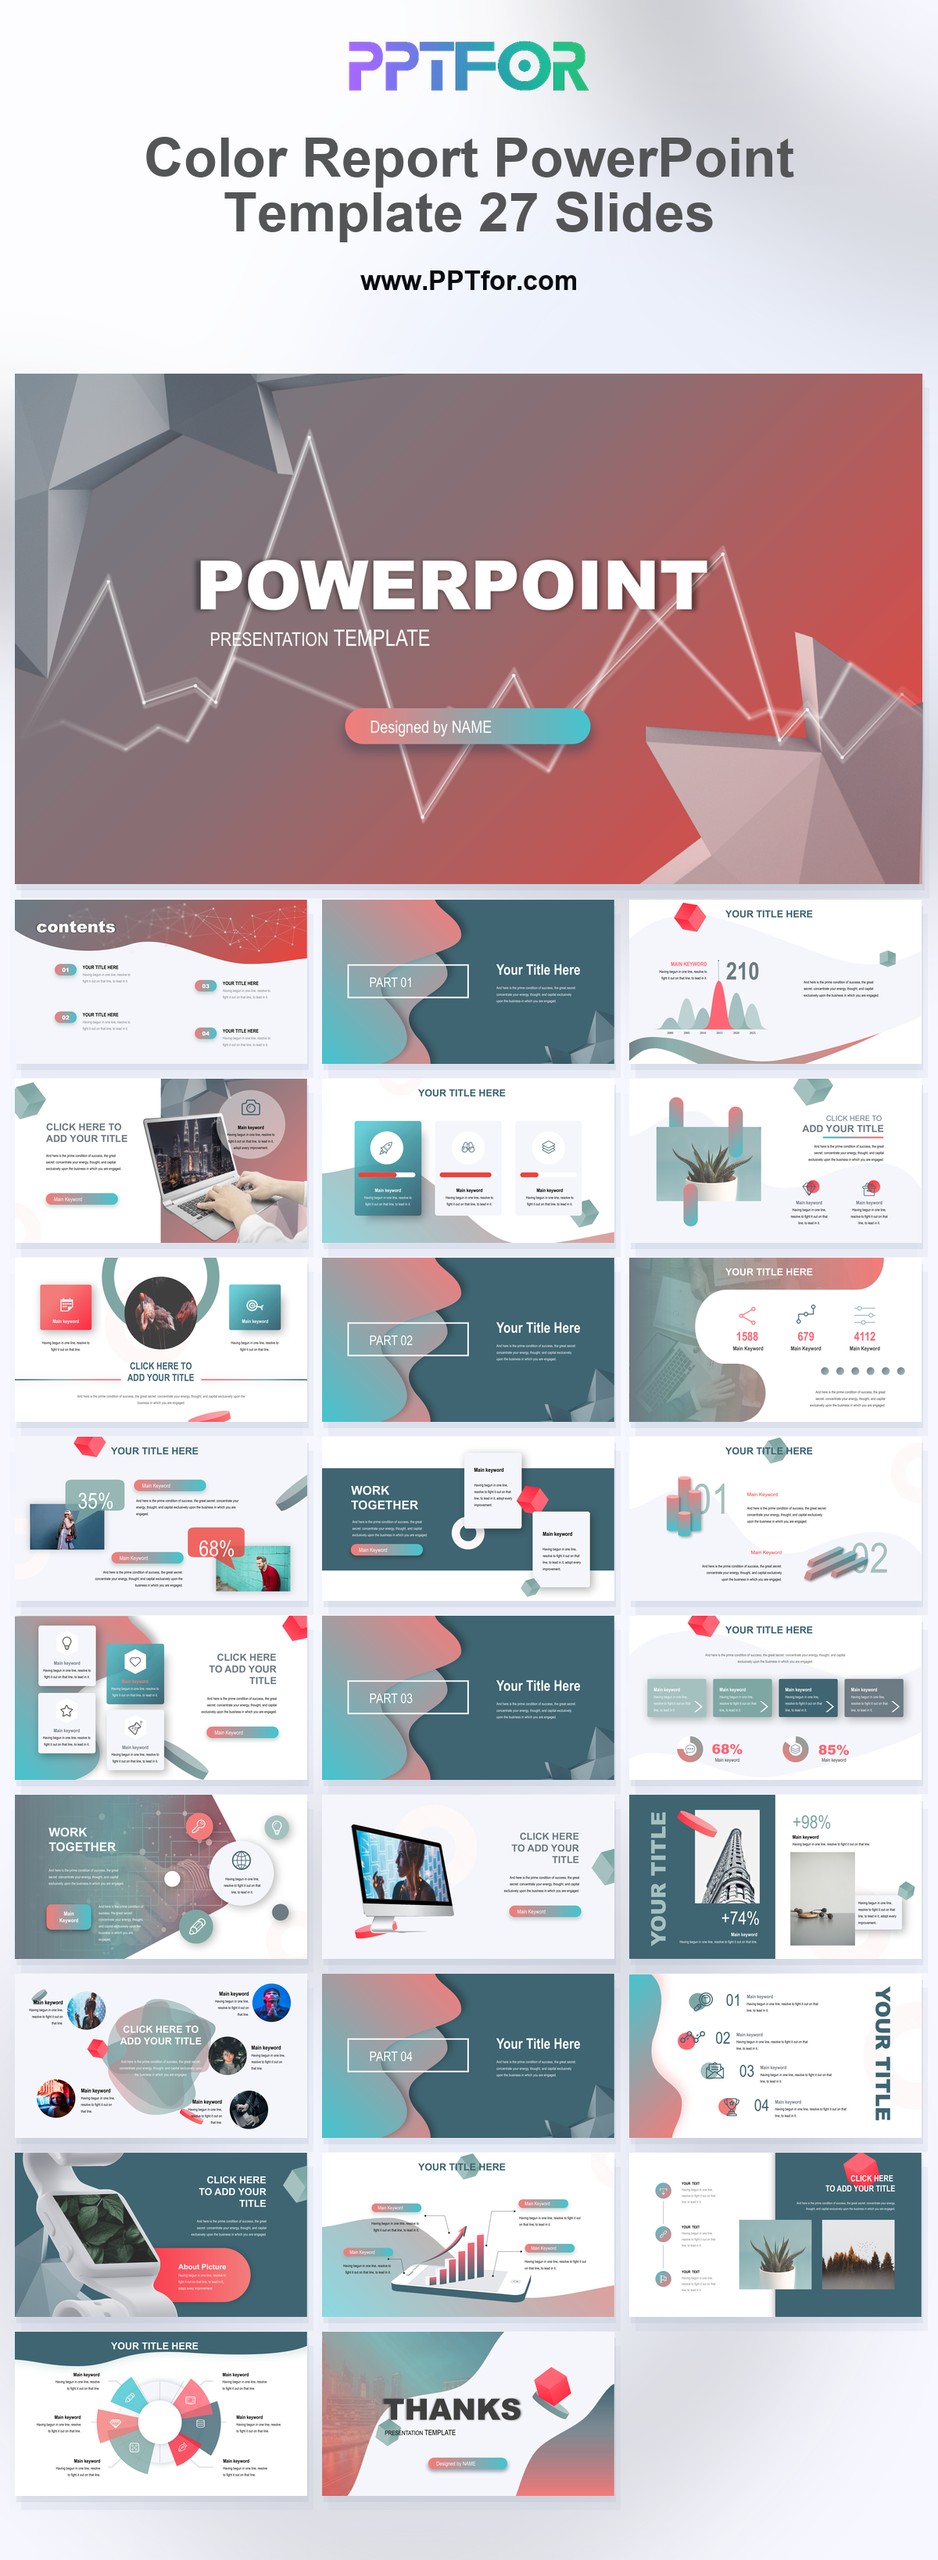
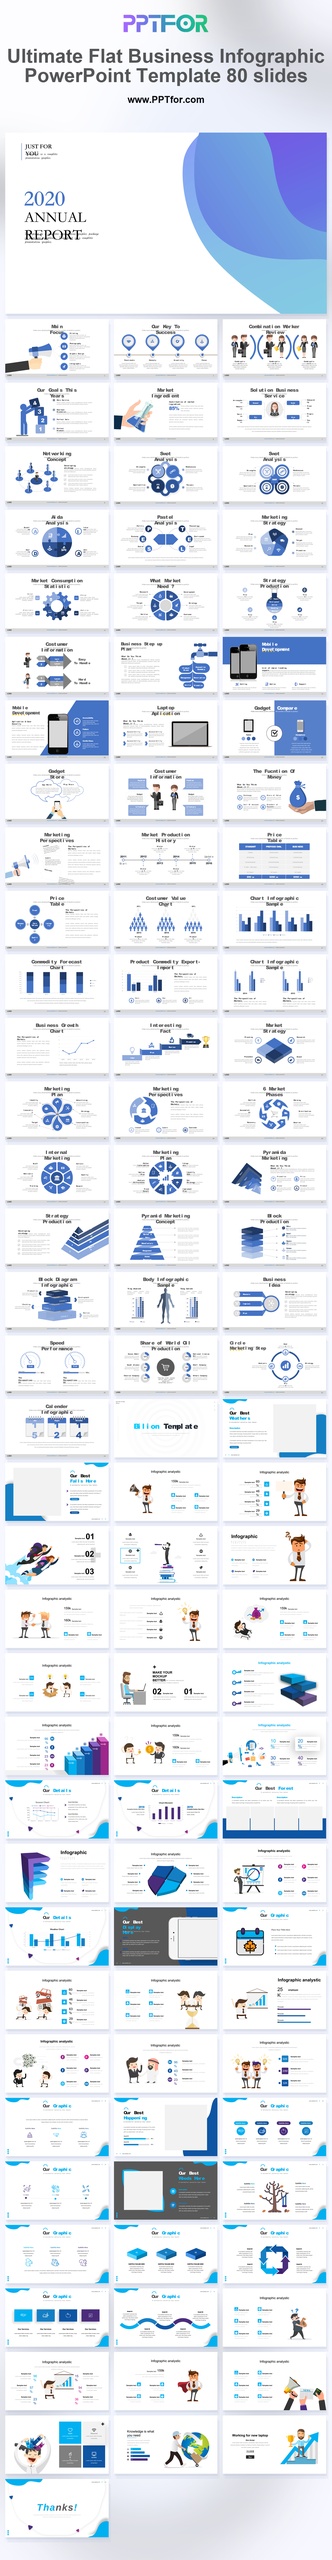
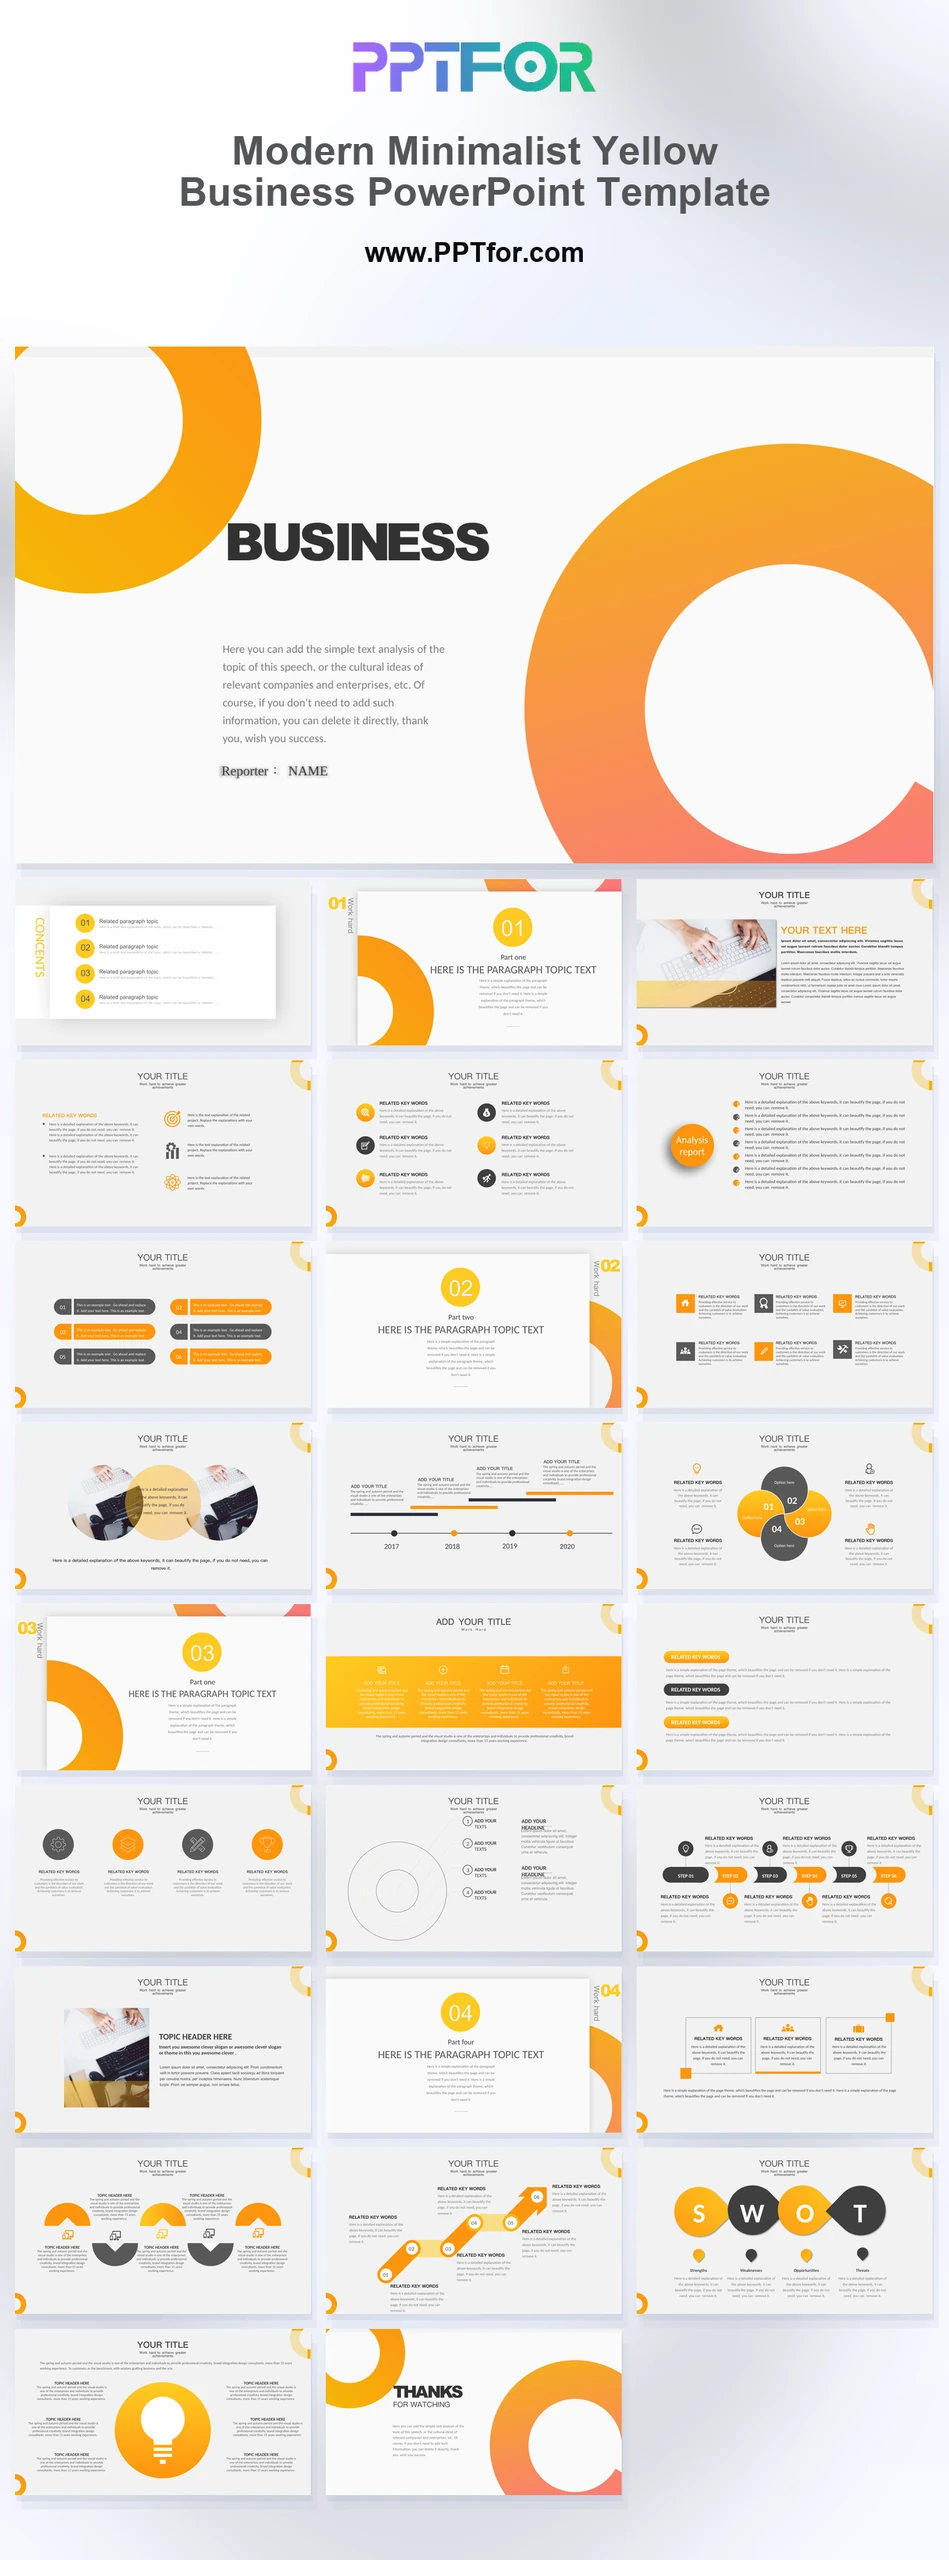
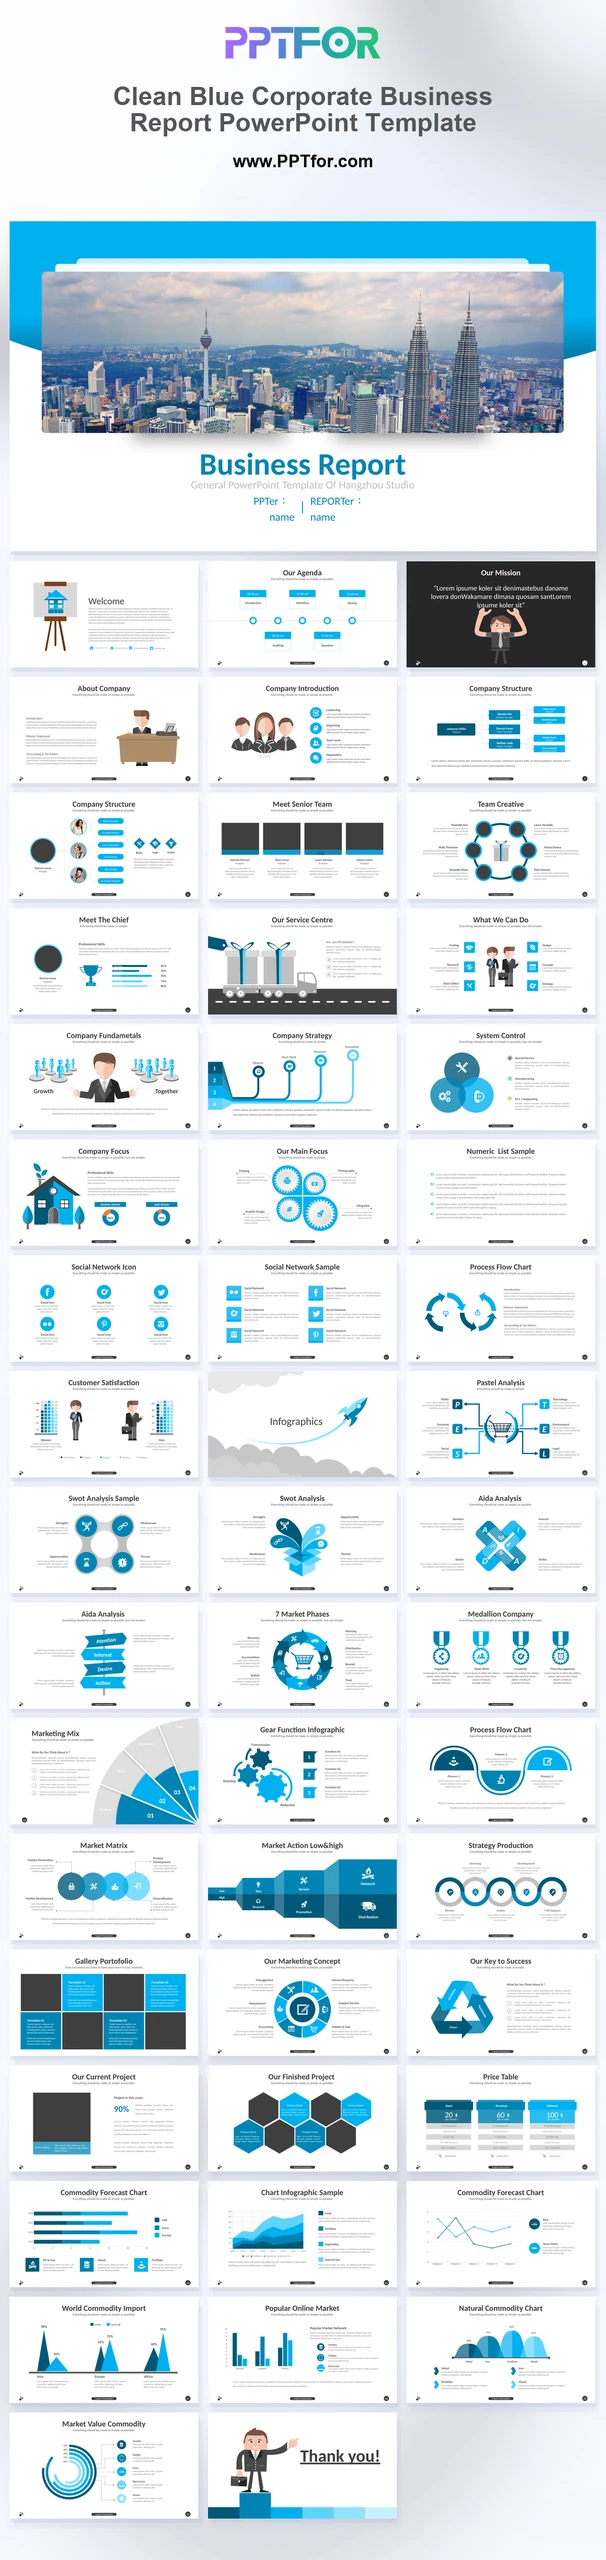
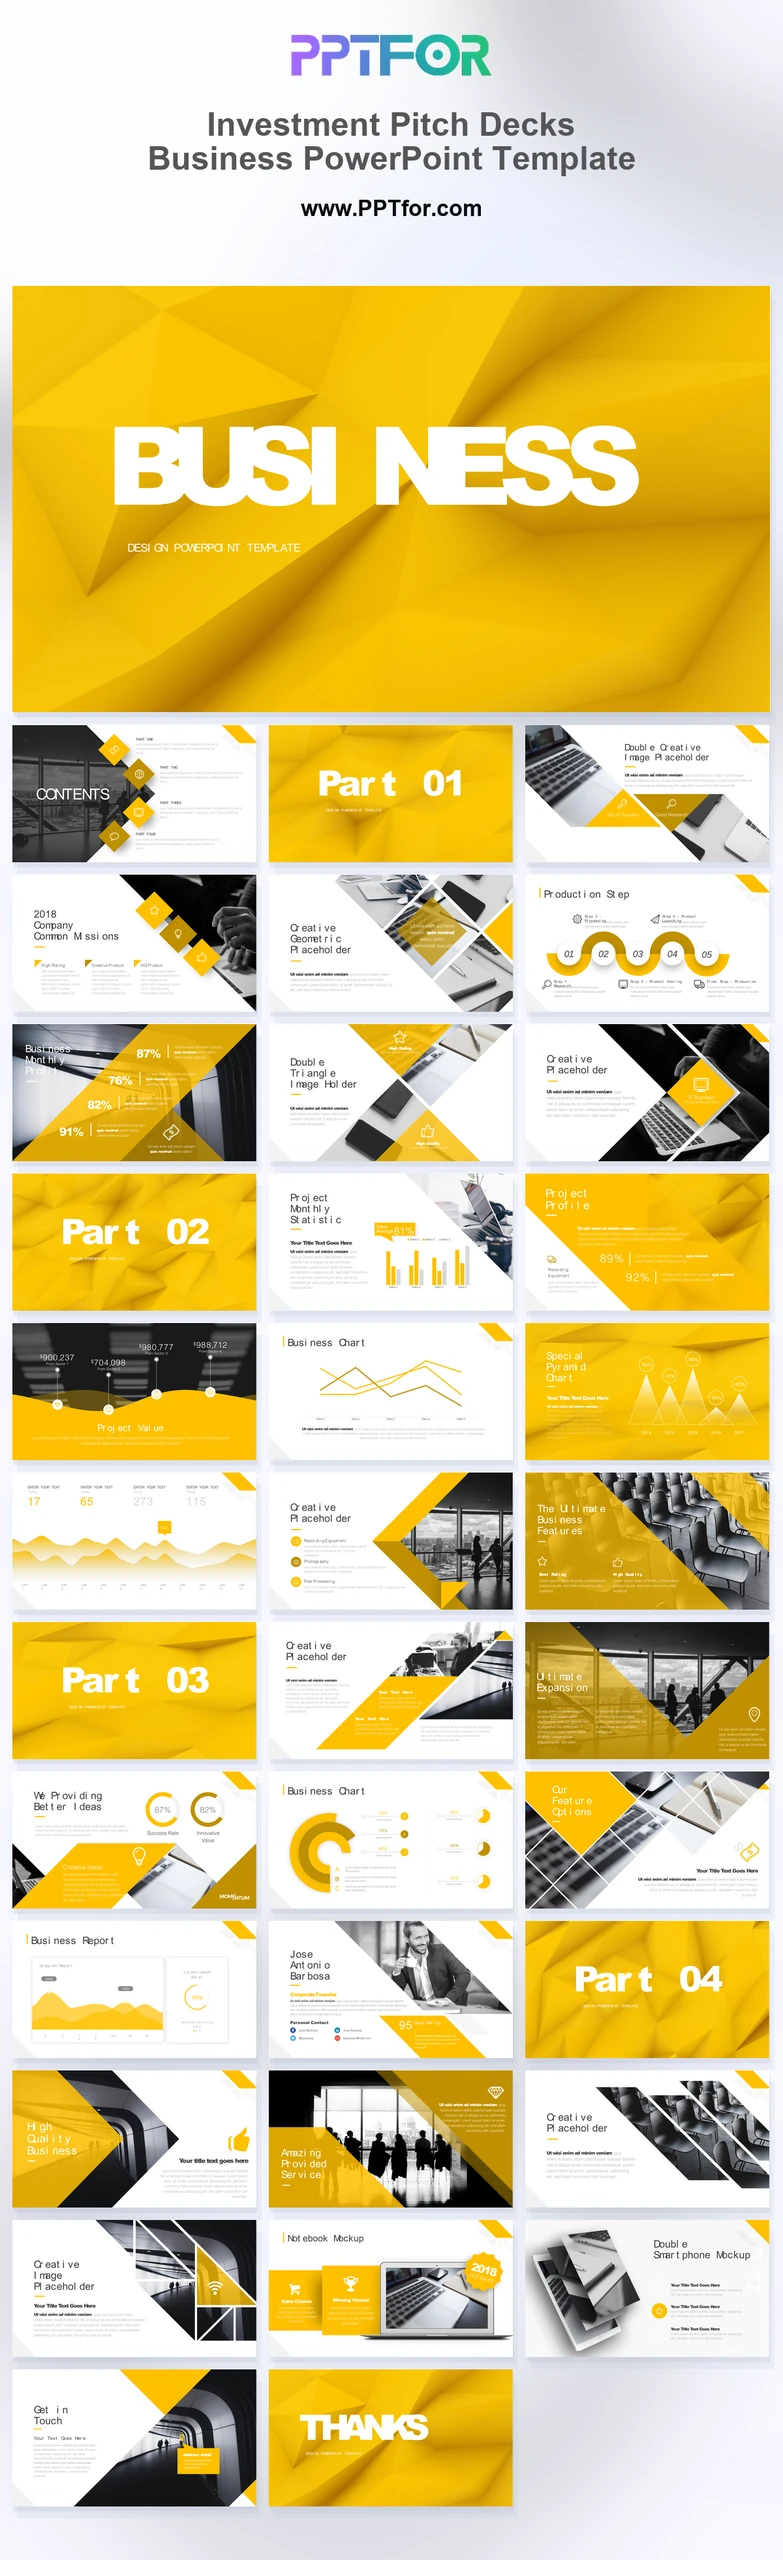
The Color Report PowerPoint Template gives analysts, consultants, marketing teams, and business leaders a clean modern deck for presenting market analysis with more energy and structure. Its colorful direction, supported by blue and white accents, helps separate business analysis, data visualization, business charts, and infographic-style report sections without making the content feel scattered. The 27-slide format is useful for summarizing data-driven insights, key metrics, trend analysis, and market findings in a flow stakeholders can review quickly. Built for Microsoft PowerPoint, Google Slides, and Apple Keynote, this template includes fully customizable slides, vector graphics, and drag-and-drop placeholders so teams can adapt the deck to their own brand, numbers, and reporting context. Download it to turn colorful market analysis into a clearer business report presentation.
It is best used for market analysis, business reporting, data visualization, and chart-based presentations where teams need to explain findings, compare trends, and summarize recommendations in a colorful 27-slide deck.
Analysts, consultants, marketers, strategy teams, and business managers can use it when they need to present market findings, business charts, and data-driven insights in a more organized format.
The template supports business analysis, data analysis, data visualization, business chart, and infographic-style report layouts, giving users a practical structure for findings, comparisons, summaries, and recommendations.
Yes. The deck includes fully customizable slides, vector graphics, and drag-and-drop placeholders, so you can edit text, colors, charts, images, and branding in PowerPoint, Google Slides, or Keynote.

Get full access to our entire collection of premium PPT templates for one simple price.
Forget about complex tools or technical skills—just choose, edit, and download.