Avatar

Ultimate Yellow Charcoal Corporate Infographics Mega Pack

by PPTFOR Editorial Team in Data & Analytics Reports

Ultimate Yellow Charcoal Corporate Infographics Mega Pack

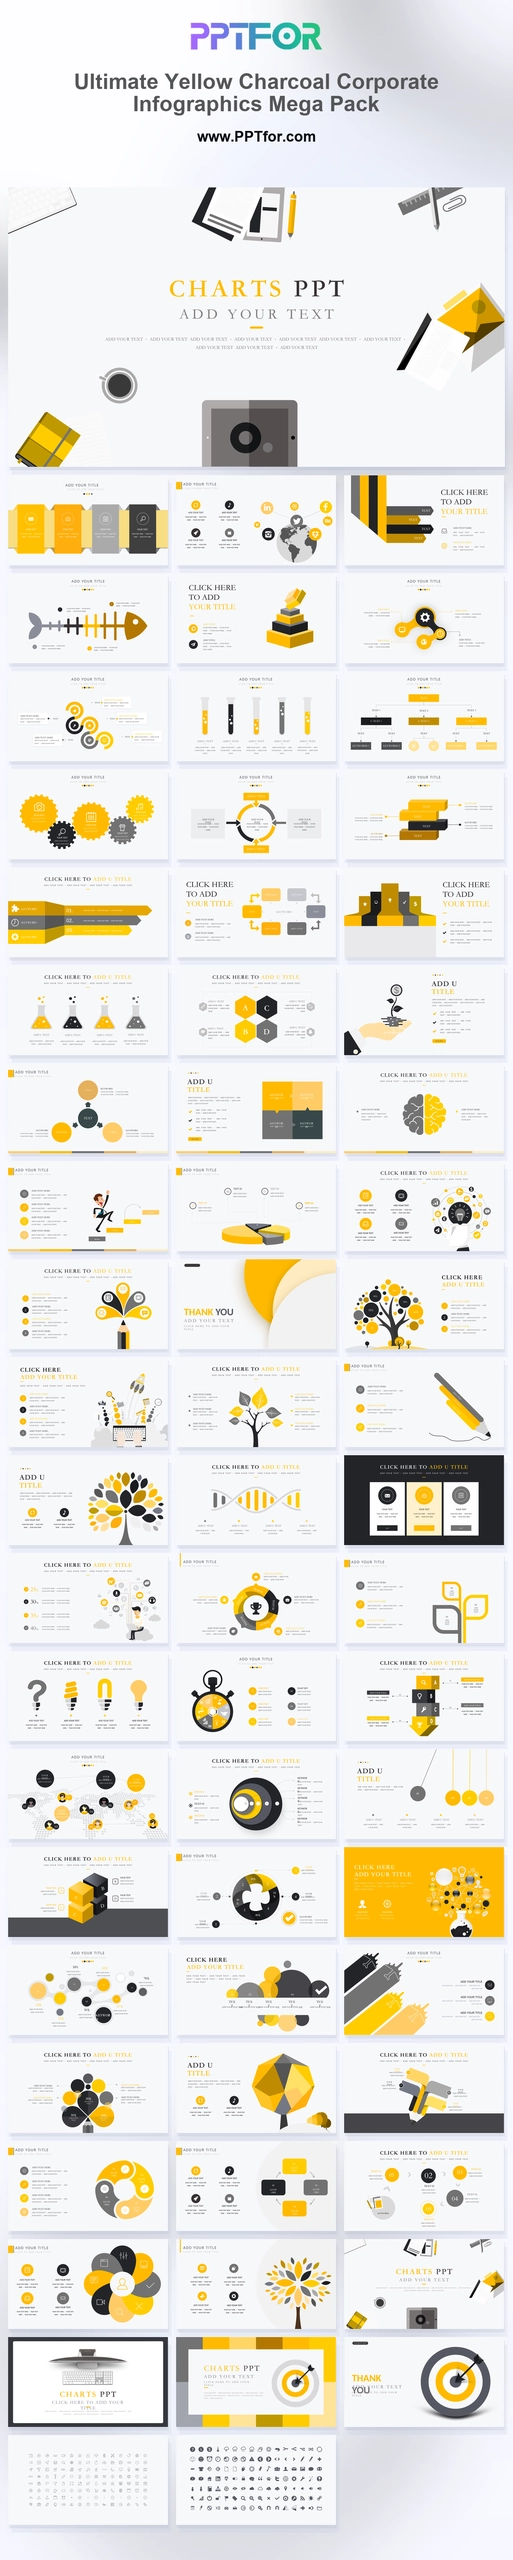
The Yellow Charcoal Corporate Infographics Mega Pack provides 60 slides for analysis and process explanation. Fishbone, hierarchy, milestone, gear, timer, and demographic layouts support a range of workshop and reporting tasks.

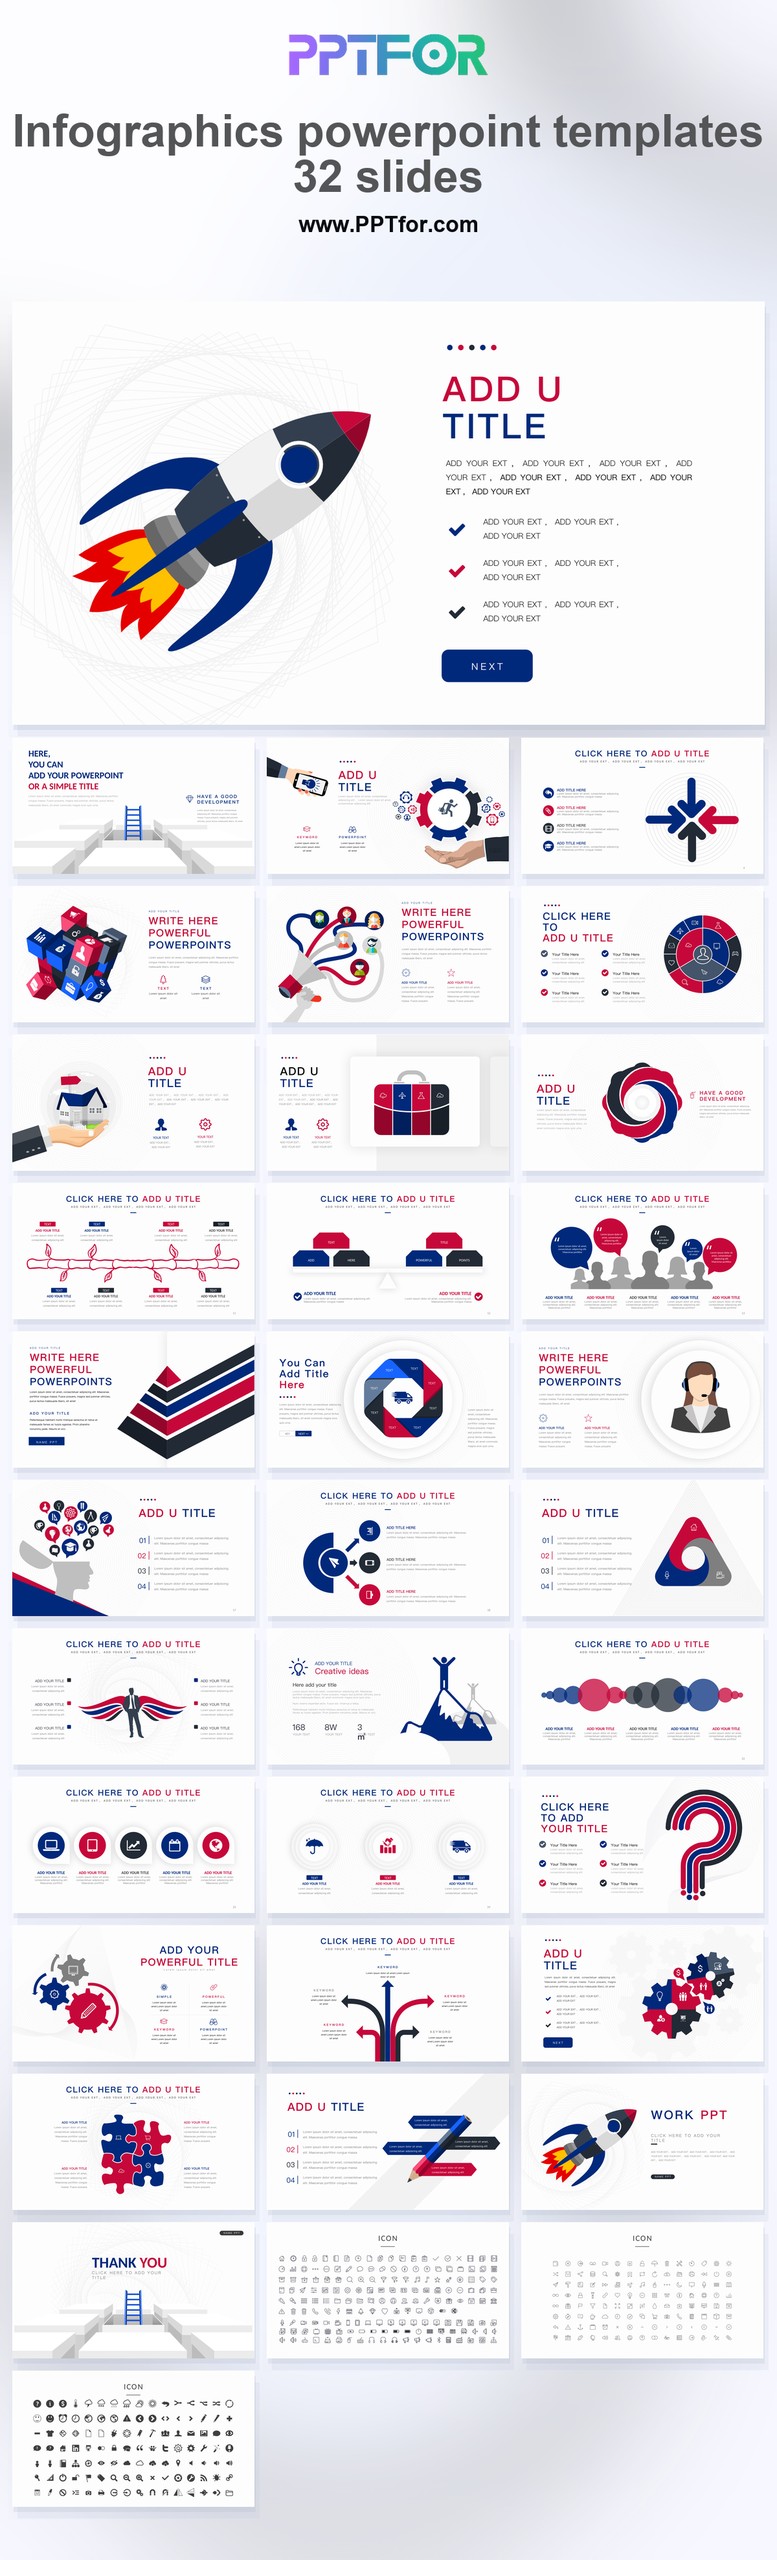
Visual elements include analytical fishbone diagrams, DNA double-helix models, scientific data flasks, puzzle steps, infographic trees, gear mechanism flows, and business character milestone tracks.

  • Compatibility: Microsoft PowerPoint. Check fonts, charts, and image placement after importing into Google Slides or Keynote.
  • Aspect Ratio: 16:9 widescreen
  • Graphics: Editable vector graphics
  • Placeholders: Drag-and-Drop Placeholders
  • Editability: Editable text, colors, fonts, and layouts
  • Slide Count: 60 slides

Suggested Uses and Presentation Tasks

  • Business analysts presenting data-heavy reports – use fishbone diagrams, pie charts, and demographic maps to make complex findings easier to review.
  • Project managers reviewing performance progress – organize milestone tracks, timer frameworks, and growth progress slides for clearer project status meetings.
  • Management consultants delivering root-cause analysis – turn cause-and-effect matrices, gear flows, and logic structures into stronger client recommendations.
  • Chief strategy officers building business roadmaps – connect hierarchy layouts, bullseye performance slides, and strategic milestones into board-ready planning content.
  • Operations directors mapping process issues – explain workflow bottlenecks, system logic, and improvement priorities with editable infographic structures.
  • Financial analysts summarizing research insights – use DNA data models, concentric charts, and structured comparison visuals for clearer investment discussions.
  • Marketing strategy teams presenting market summaries – combine maps, target graphics, and data visualization slides to frame audience and performance trends.

Frequently Asked Questions

When should I choose this template?

Choose this larger collection when you repeatedly need different analytical diagrams in the same visual style. Use the fishbone layout to organize possible causes, then verify those causes with evidence.

What should I prepare before editing?

Prepare the problem statement, candidate causes, process stages, and measured results. Distinguish workshop hypotheses from validated findings when moving the diagrams into a management report.

What infographic layouts are included in this 60-slide template?

The deck includes fishbone cause-and-effect matrices, DNA helix data structures, analytics flasks, hierarchy layouts, growth progress slides, milestone steps, gear logic flows, timer frameworks, concentric pie charts, demographic maps, bullseye performance slides, and a 400+ icon grid.

How can I edit the template?

Edit the text, colors, and slide elements to match your presentation. Before updating a graphic, check whether it is a native chart, a grouped shape, or an image; the editing method differs.



Post a Comment

$15

$

  • Price is in US dollars and excludes tax
  • Size:16x9
  • Microsoft PowerPoint, Google Slides, Apple Keynote, PowerPoint for Mac / Office 365, WPS Office
  • 100% editable
  • What you see is what you get
  • This is a secure SSL encrypted payment. Credit Card Certificate

Get all products for only $29!

Get full access to our entire collection of premium PPT templates for one simple price.
Forget about complex tools or technical skills—just choose, edit, and download.