Avatar

Cyber Fiber Optic Data Analysis PPT Template

by PPTFOR Editorial Team in Data & Analytics Reports

Cyber Fiber Optic Data Analysis PPT Template

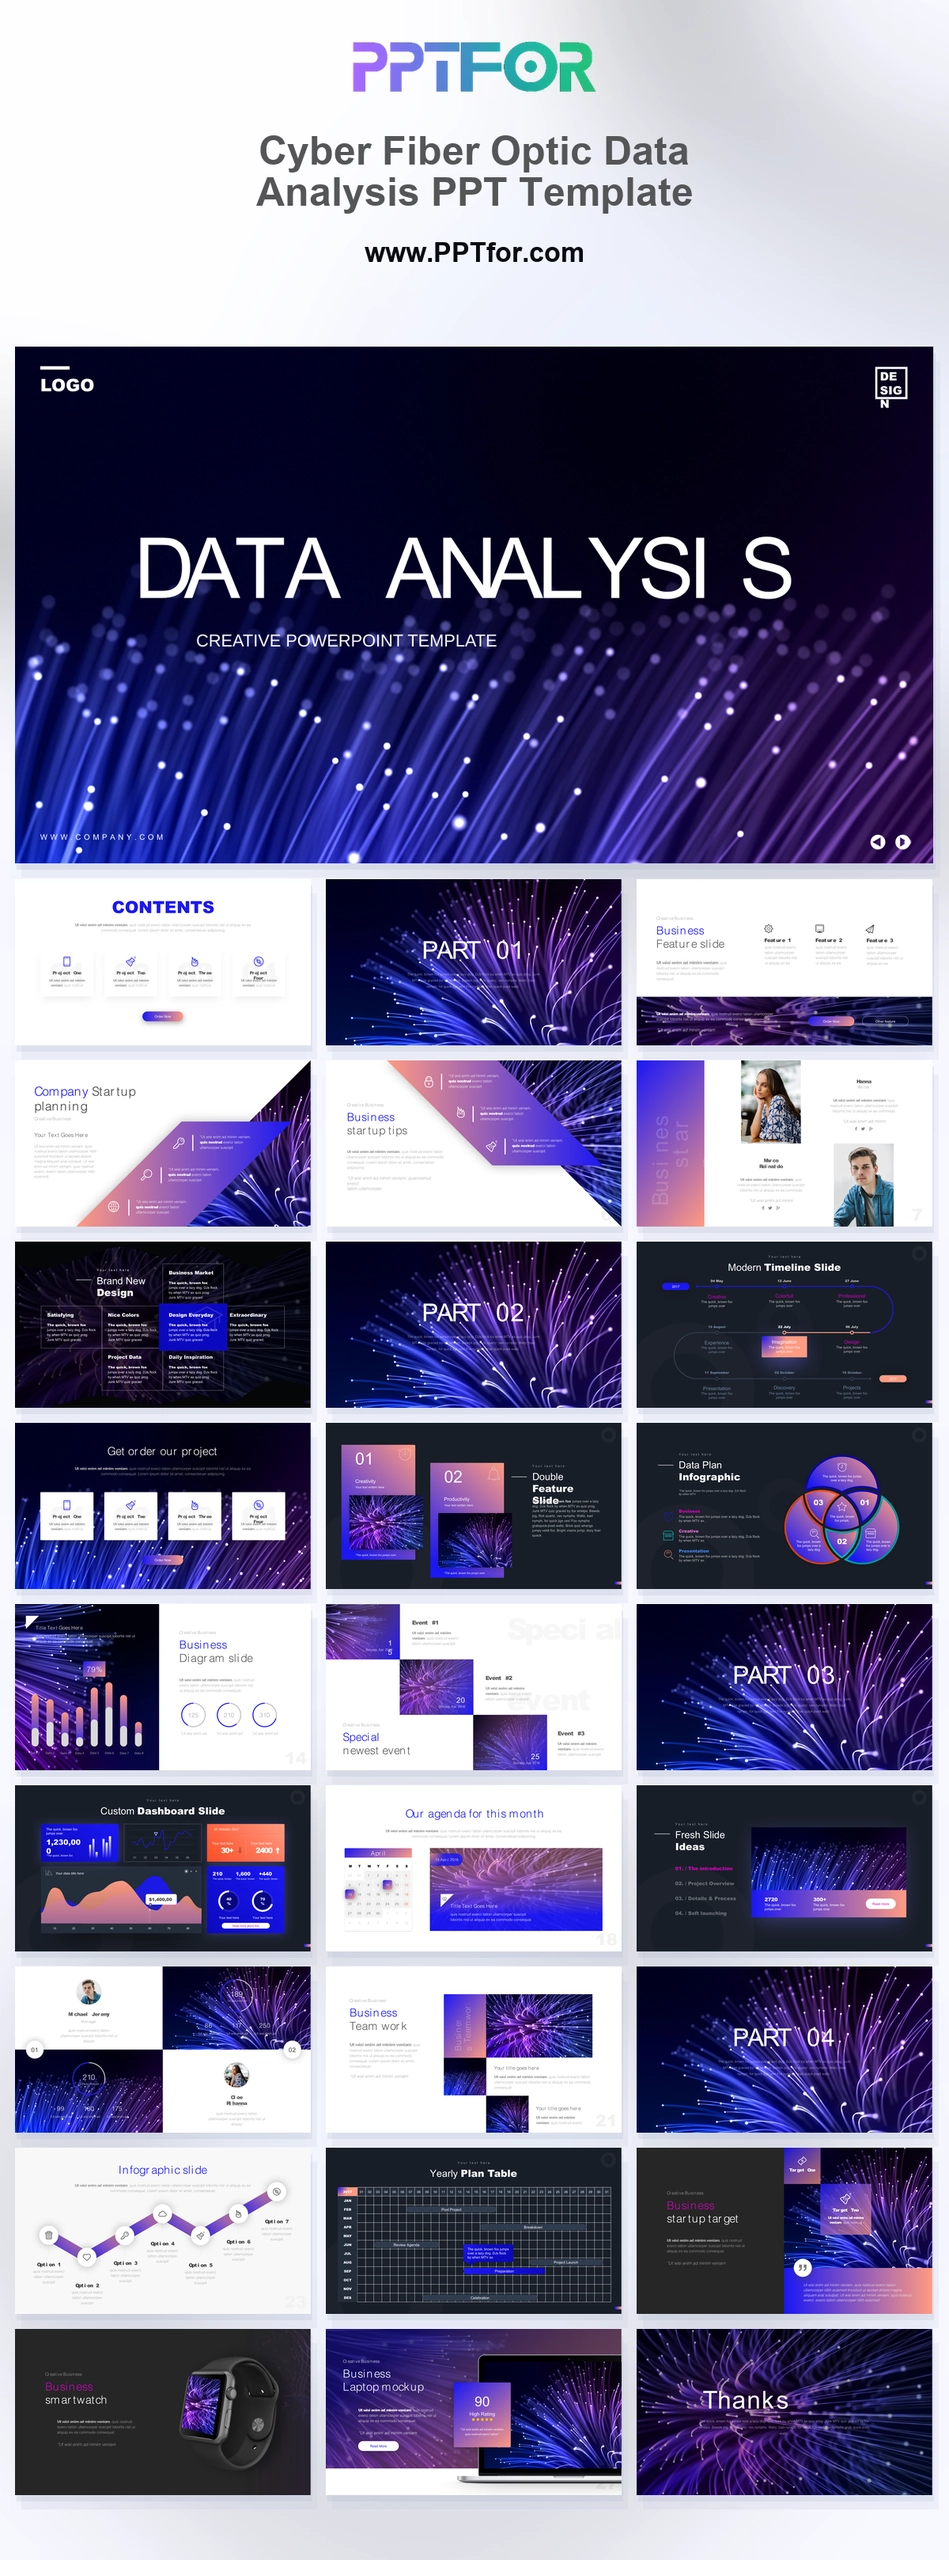
The Cyber Fiber Optic Data Analysis PPT Template offers 28 slides with particle imagery, growth charts, planning diagrams, and a calendar grid. Use it to present technology findings alongside the timeline or project context behind them.

Visual elements include glowing fiber optic paths, neon particle streams, ultraviolet and indigo backgrounds, sunset coral-to-purple blocks, luminous data visualizations, metric columns, and smartwatch and laptop mockups.

  • Compatibility: Microsoft PowerPoint. Check fonts, charts, and image placement after importing into Google Slides or Keynote.
  • Aspect Ratio: 16:9 widescreen
  • Graphics: Editable vector graphics
  • Placeholders: Drag-and-Drop Placeholders
  • Editability: Editable text, colors, fonts, and layouts
  • Slide Count: 28 slides

Suggested Uses and Presentation Tasks

  • CTOs leading data analysis reviews – organize growth charts, dashboards, and roadmap slides for executive technology decisions.
  • Data analysts building financial analytics reports – use metric layouts, Venn data diagrams, and luminous charts to explain trend analysis and key metrics.
  • IT directors running quarterly performance audits – present system progress, calendar planning, and dashboard findings in a high-contrast review format.
  • Tech founders presenting product roadmaps – connect startup planning, timeline trajectories, and MacBook mockups into a clearer launch narrative.
  • Product managers coordinating SaaS roadmap decks – use device mockups, project grids, and growth bars to align teams around product priorities.
  • Analytics leads briefing cybersecurity strategy – frame risk themes, infrastructure metrics, and next-step recommendations with cyber data-driven visuals.
  • Fintech consultants preparing client updates – combine financial reporting slides, dashboards, and gradient data blocks for more readable stakeholder summaries.

Frequently Asked Questions

When should I choose this template?

Choose this deck for a technology-oriented analysis update that benefits from product imagery and planning content. Use straightforward charts for quantitative findings so the visual theme does not compete with the evidence.

What should I prepare before editing?

Prepare dataset scope, metric definitions, dates, and the decisions informed by the analysis. Separate observations from hypotheses and keep source notes beside the charts they support.

What layouts are included in this 28-slide data analysis deck?

The deck includes a particle master cover, linear contents outline, part transitions, startup planning slide, timeline trajectory, project grid, Venn plan diagrams, growth bar charts, analytics dashboard, calendar grid, Apple Watch mockup, MacBook Pro showcase, and closing slide.

How can I edit the template?

Edit the text, colors, and slide elements to match your presentation. Before updating a graphic, check whether it is a native chart, a grouped shape, or an image; the editing method differs.



Post a Comment

$15

$

  • Price is in US dollars and excludes tax
  • Size:16x9
  • Microsoft PowerPoint, Google Slides, Apple Keynote, PowerPoint for Mac / Office 365, WPS Office
  • 100% editable
  • What you see is what you get
  • This is a secure SSL encrypted payment. Credit Card Certificate

Get all products for only $29!

Get full access to our entire collection of premium PPT templates for one simple price.
Forget about complex tools or technical skills—just choose, edit, and download.