 Get full access to premium PowerPoint templates at a limited-time price.Get Now
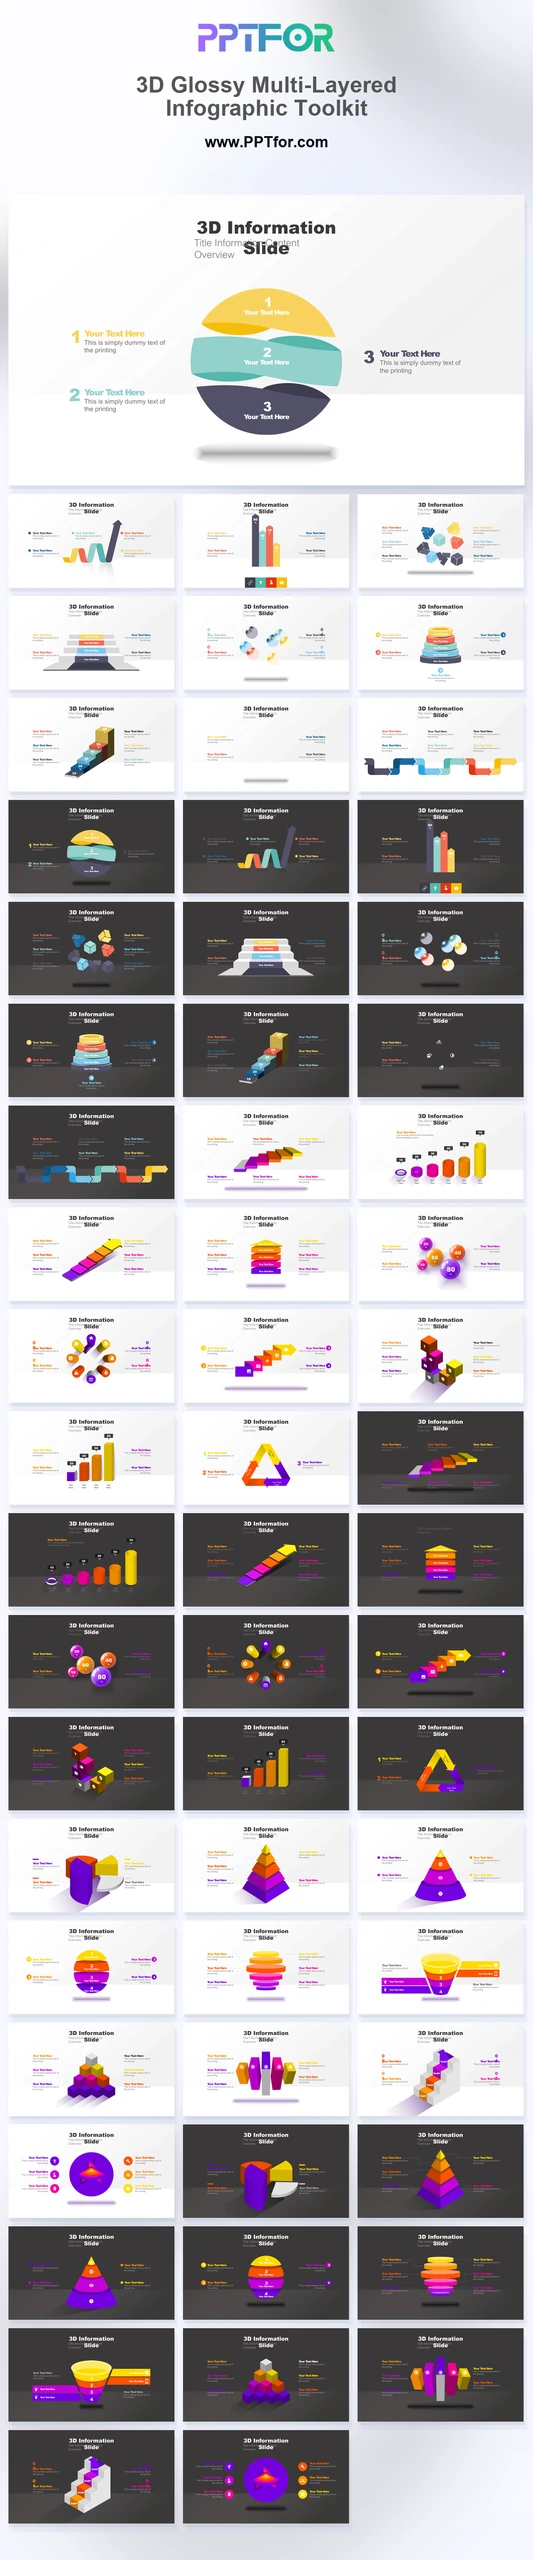
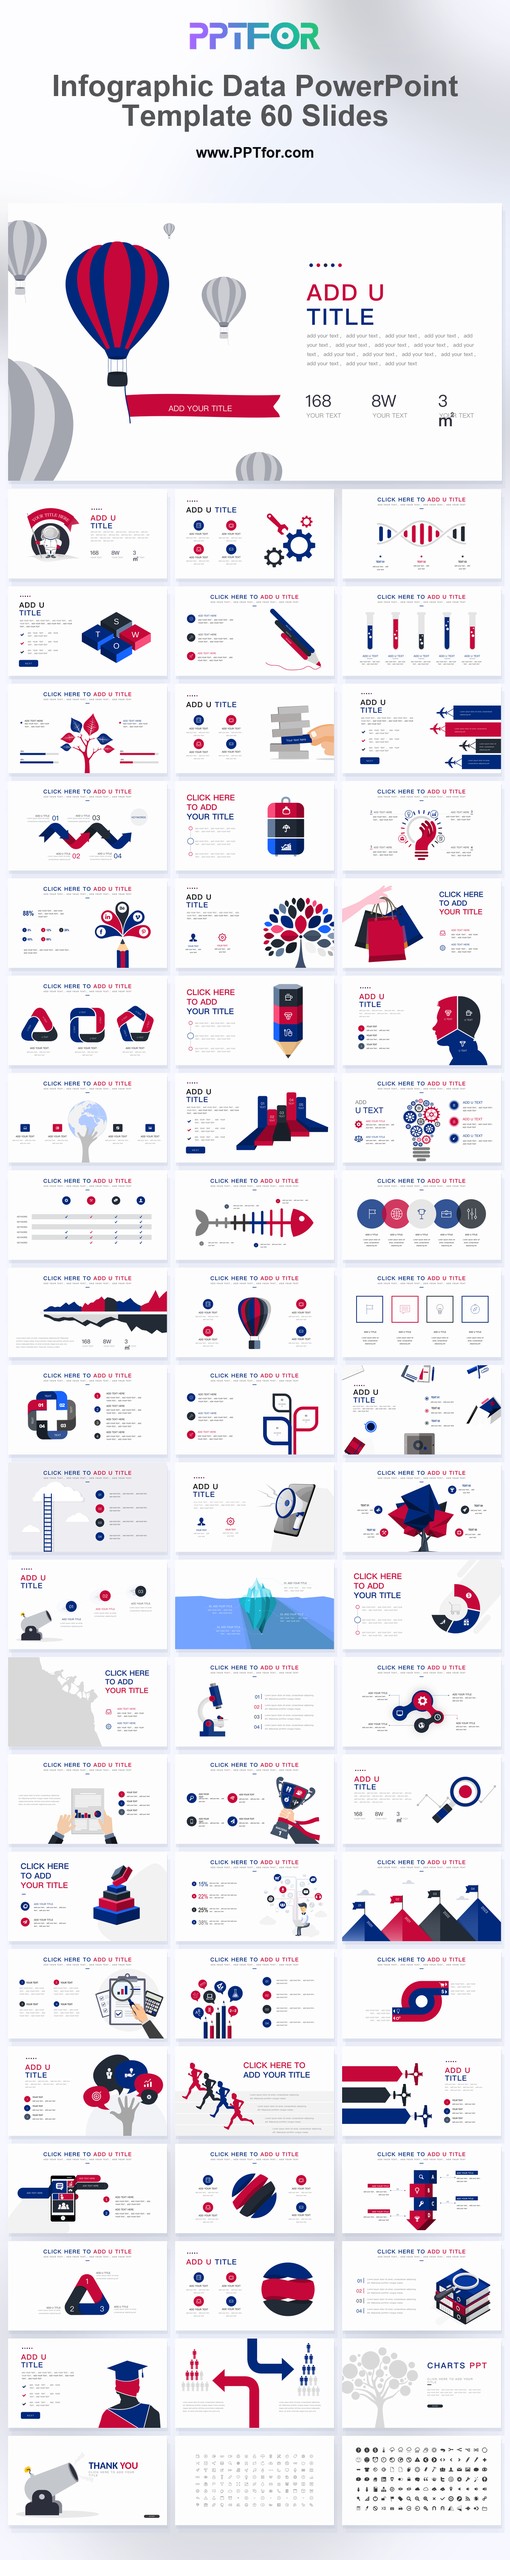
Use this 3D glossy multi-layered infographic toolkit for annual reports, financial audits, market research, and KPI dashboards in 60 slides.
The 3D Glossy Multi-Layered Infographic Toolkit gives data analysts, CFOs, operations directors, business intelligence leads, and project portfolio managers a 60-slide system for data-heavy annual reports, corporate financial audits, quantitative market research reviews, executive KPI dashboards, and complex process architectural modeling. High-gloss 3D geometric shapes, segmented spheres, layered pyramids, neon fluid gradients, light and dark backgrounds, and quantitative data models create a vibrant data-heavy style for business intelligence, finance, market research, data science, consulting, engineering, and operations teams. This template supports performance indicators through split sphere diagrams, comparison graphs, pyramid matrices, funnel and cone layouts, cylindrical flowcharts, spiral growth indicators, cluster networks, ring processes, and triangular loop frameworks. Template compatibility includes Microsoft PowerPoint, Google Slides, Apple Keynote, PowerPoint for Mac / Office 365, and WPS Office, with editable vector 3D shapes, curves, drag-and-drop structural placeholders, and customizable slides, colors, fonts, and layouts. Customize this toolkit now and turn dense metrics into sharper executive-ready visual models.
This toolkit is best used for data-heavy annual reports, corporate financial audits, quantitative market research reviews, executive KPI dashboards, and complex process modeling that need dimensional infographic visuals.
Data analysts, CFOs, operations directors, business intelligence leads, project portfolio managers, consultants, engineering teams, and market researchers can use this toolkit for reporting, analysis, dashboard design, and executive presentations.
The toolkit includes split sphere core diagrams, multi-column comparison graphs, layered pyramid matrices, funnel and cone layouts, cylindrical flowcharts, spiral staircase growth indicators, spherical cluster network sheets, geometric ring processes, and triangular loop frameworks.
Yes. The template works with Microsoft PowerPoint, Google Slides, Apple Keynote, PowerPoint for Mac / Office 365, and WPS Office, with 100% vector graphics, editable 3D shapes and curves, drag-and-drop placeholders, and customizable slides, colors, fonts, and layouts.

Get full access to our entire collection of premium PPT templates for one simple price.
Forget about complex tools or technical skills—just choose, edit, and download.