Get full access to premium PowerPoint templates at a limited-time price.Get Now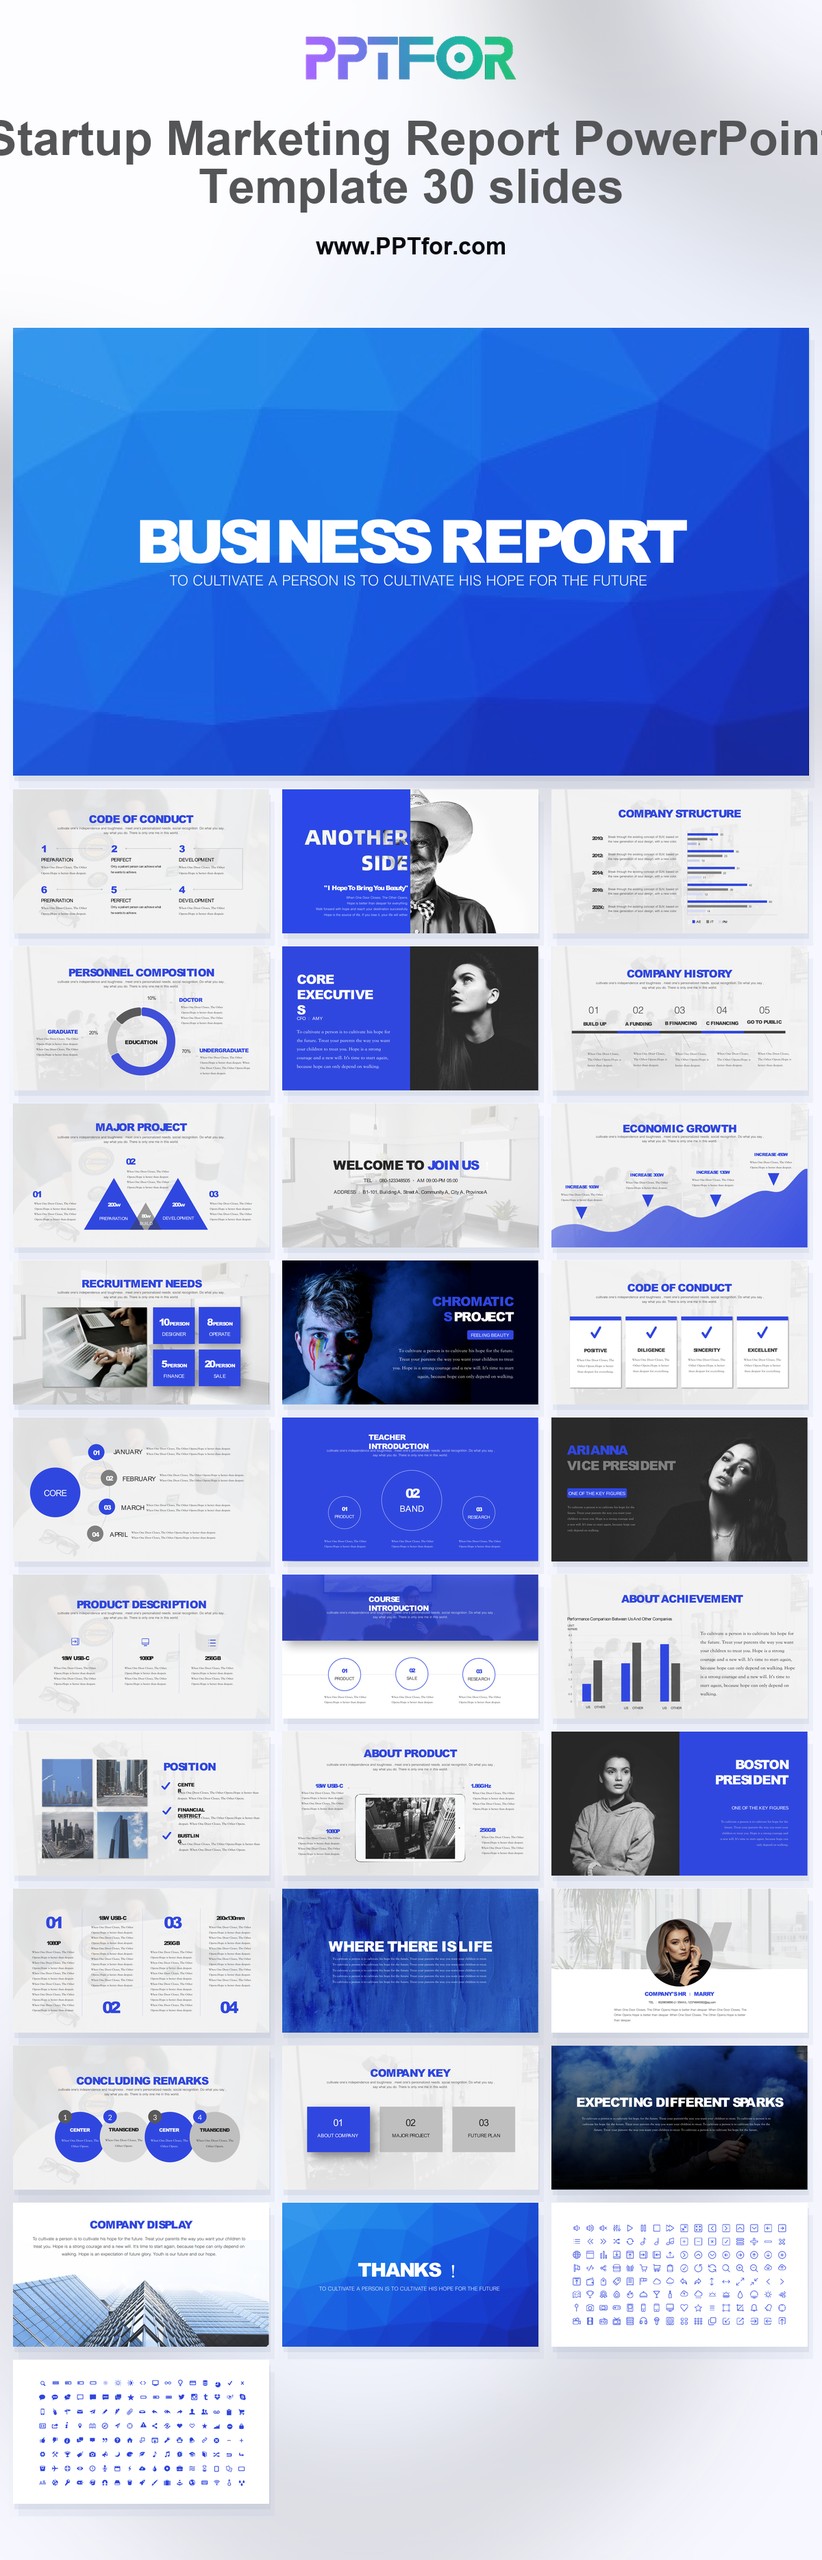
A marketing report template in PowerPoint turns campaign data into a presentation that decision-makers can understand quickly. The strongest reports do more than display charts: they connect objectives, channel performance, audience behavior, budget, and next actions in one consistent story.
This guide explains which slides to include, how to structure the narrative, and which editable PPTFOR templates fit different reporting needs.
A decision-ready marketing report PowerPoint should include the reporting period, objectives, KPI definitions, actual versus target performance, channel and campaign results, audience insights, budget efficiency, key findings, recommendations, owners, and the next reporting plan. Detailed exports belong in an appendix, not the main presentation.
| Metric group | Show in the main deck | Quality check |
|---|---|---|
| Business outcome | Revenue, qualified pipeline, purchases, retained customers, or another agreed outcome | State the attribution method and reporting period |
| Acquisition | Sessions, leads, sign-ups, conversion rate, and cost per acquisition | Use the same channel definitions across periods |
| Campaign | Spend, reach, clicks, conversions, cost per result, and return where reliable | Separate observed results from modeled revenue |
| Content | Top landing pages, offers, formats, and assisted outcomes | Do not rank content on traffic alone when the objective is conversion |
| Next action | Recommendation, owner, due date, expected effect, and validation method | Connect every recommendation to a finding in the report |
Editorial method: PPTFOR separates objectives, observed results, interpretation, and recommendations so the deck can be audited after the meeting. Metric definitions should follow the analytics and advertising platforms used by the reporting team. Google Analytics documents traffic-source dimensions and scopes; verify current definitions inside your own property before presenting results.
A marketing report PowerPoint is a slide deck used to communicate marketing performance over a defined period. It may cover a campaign, month, quarter, or full year. Unlike a live dashboard, the presentation adds context and recommendations to the numbers.
A useful deck should answer five questions:
If a slide does not help answer one of these questions, it may belong in an appendix rather than the main presentation.
Open with the reporting period, top outcomes, major risks, and two or three recommended actions. Executives should be able to understand the conclusion without reading every slide.
Restate the campaign or marketing objectives and define the KPIs used in the report. Separate business outcomes such as revenue or qualified pipeline from diagnostic metrics such as impressions and click-through rate.
Use a compact scorecard for actual results, targets, prior-period results, and variance. Apply the same visual treatment to every KPI so the audience can scan the slide quickly.
Compare paid search, organic search, email, social, referral, events, or other relevant channels. Use a table or grouped chart instead of giving every channel its own slide unless the audience needs operational detail.
Show campaign-level spend, reach, engagement, leads, conversions, and return. Highlight the strongest and weakest campaigns, then explain the reason for the difference.
Summarize the segments, industries, locations, devices, or customer groups that responded best. Connect the insight to a practical targeting or messaging decision.
Identify the pages, offers, ads, emails, or creative formats that contributed most to the result. A ranked bar chart works better than a dense content inventory.
Visualize movement from awareness to action. Include the conversion rate between stages so the audience can see where the largest drop occurs.
Compare planned and actual spend, cost per result, and return on investment where revenue attribution is reliable. Clearly label modeled or estimated values.
Convert the analysis into three to five concise findings. Each finding should combine evidence, interpretation, and business significance.
Prioritize actions by expected impact and effort. Assign an owner and timeframe when the deck is used for an internal review.
Close with the next reporting period’s priorities, experiments, target changes, and key dates. This turns the report into a decision tool rather than a historical archive.
| Template | Best for | Useful features |
|---|---|---|
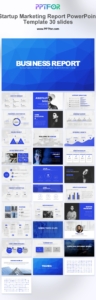
| Startup Marketing Report PowerPoint Template | Monthly and quarterly startup reporting | 30 slides, editable vector graphics, drag-and-drop placeholders, PowerPoint, Google Slides, and Keynote compatibility |
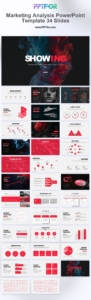
| Marketing Analysis PowerPoint Template – 34 Slides | Campaign analysis and channel comparisons | Structured marketing analysis layouts for data, findings, and recommendations |
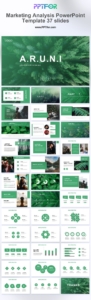
| Marketing Analysis PowerPoint Template – 37 Slides | Detailed performance reviews | Additional slide variety for metrics, comparisons, and strategic conclusions |
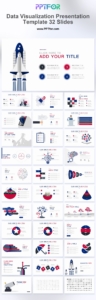
| Data Visualization Report Presentation Template | Data-heavy reports and dashboards | 32 editable slides for charts, SWOT reviews, market analysis, and visual reporting |
Choose the deck according to the audience and decision, not only its visual style.
Before selecting a template, list the charts and tables your report requires. Then confirm that the deck contains compatible layouts. This is faster than forcing every metric into a visually attractive but unsuitable design.
Start with the conclusion and work backward. A practical sequence is:
Avoid presenting screenshots from several analytics tools without interpretation. Rebuild the important numbers in a consistent visual system and cite the data source in a small footer.
For a period-specific structure, see the guides to an annual marketing report PowerPoint template and a quarterly marketing report PowerPoint. Teams preparing an external review can also use the framework for presenting campaign results to clients.
Use an executive summary followed by objectives, KPI performance, channel and campaign analysis, audience insights, budget, findings, recommendations, and a next-period plan. The exact level of detail should match the audience.
Most decision-focused reports work well with 10 to 15 main slides. Add detailed campaign tables, definitions, and supporting charts in an appendix.
No. Include metrics that explain progress toward the objective or support a decision. Diagnostic metrics can be added only when they help explain why the primary KPI changed.
The featured PPTFOR templates list compatibility with Microsoft PowerPoint, Google Slides, and Apple Keynote. Review the individual product page before downloading to confirm the available formats.
Start with an editable marketing report PowerPoint template and replace the sample content with your objectives, verified metrics, findings, and recommendations. A consistent slide system makes recurring reporting faster while keeping the presentation clear for executives, clients, and marketing teams.
Get full access to our entire collection of premium PPT templates for one simple price.
Forget about complex tools or technical skills—just choose, edit, and download.