Get full access to premium PowerPoint templates at a limited-time price.Get Now
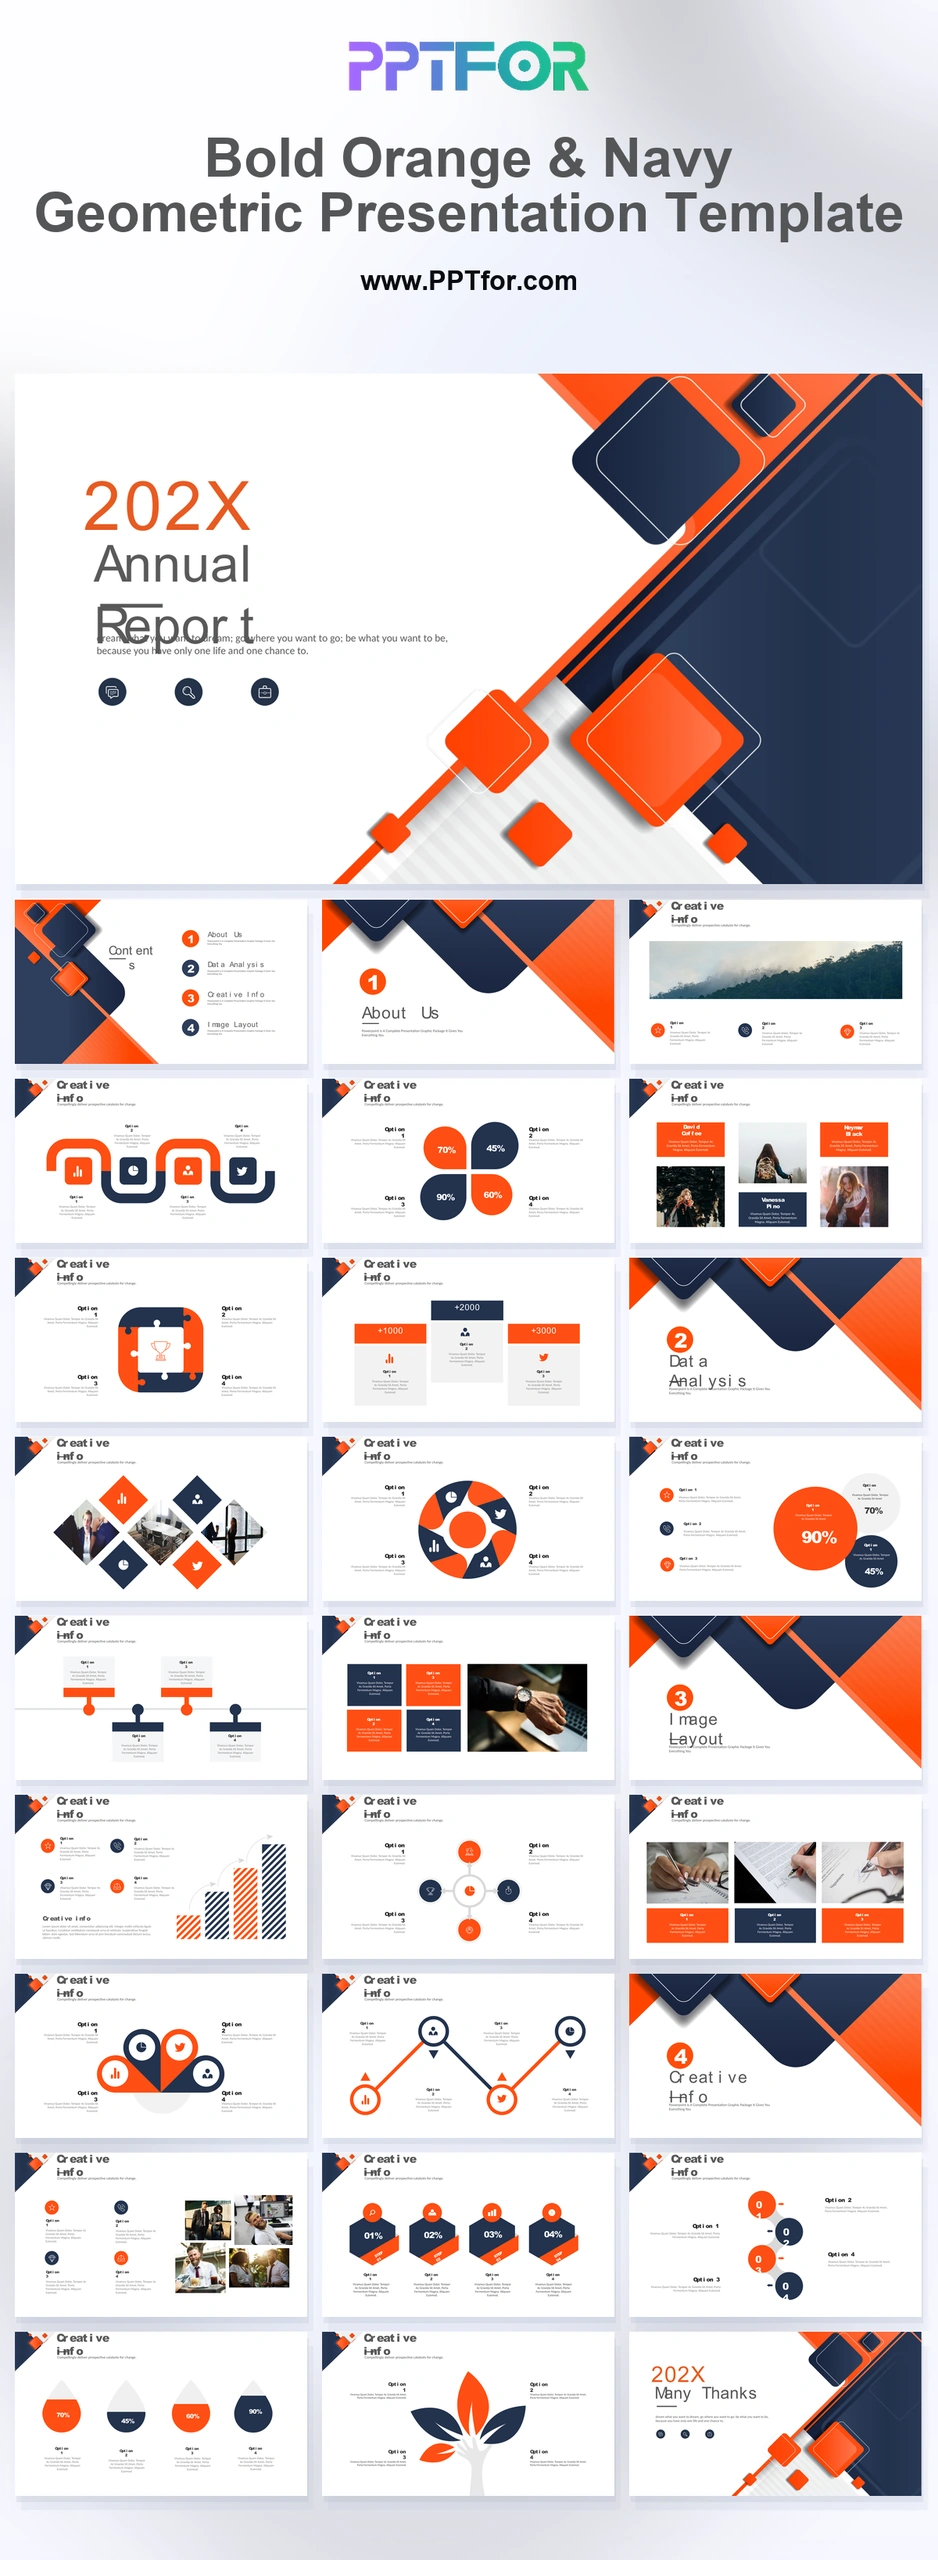
The Bold Orange and Navy Geometric Presentation Template offers 27 slides for business proposals and reviews. Corporate-profile, process, pipeline, network, and growth-chart layouts support a presentation about how a business delivers results.
Visual elements include overlapping diagonal square graphics, textured linear backgrounds, multi-colored process funnels, interlocking puzzle grids, and handshake corporate photography.
Choose this orange-and-navy deck when you need to explain a workflow alongside company information. Give each process stage a named input, output, or owner so the diagrams communicate specific work.
Prepare company facts, process stages, pipeline definitions, and source figures. Use labels as well as color when comparing categories, and make the reporting period explicit.
The deck includes a geometric cover, executive summary contents, color block transitions, corporate profile, team grid, curving process flow, puzzle matrix, pie charts, workplace gallery, pipeline chevron, performance charts, node networks, growth chart, and closing slide.
Edit the text, colors, and slide elements to match your presentation. Before updating a graphic, check whether it is a native chart, a grouped shape, or an image; the editing method differs.

Get full access to our entire collection of premium PPT templates for one simple price.
Forget about complex tools or technical skills—just choose, edit, and download.