Get full access to premium PowerPoint templates at a limited-time price.Get Now
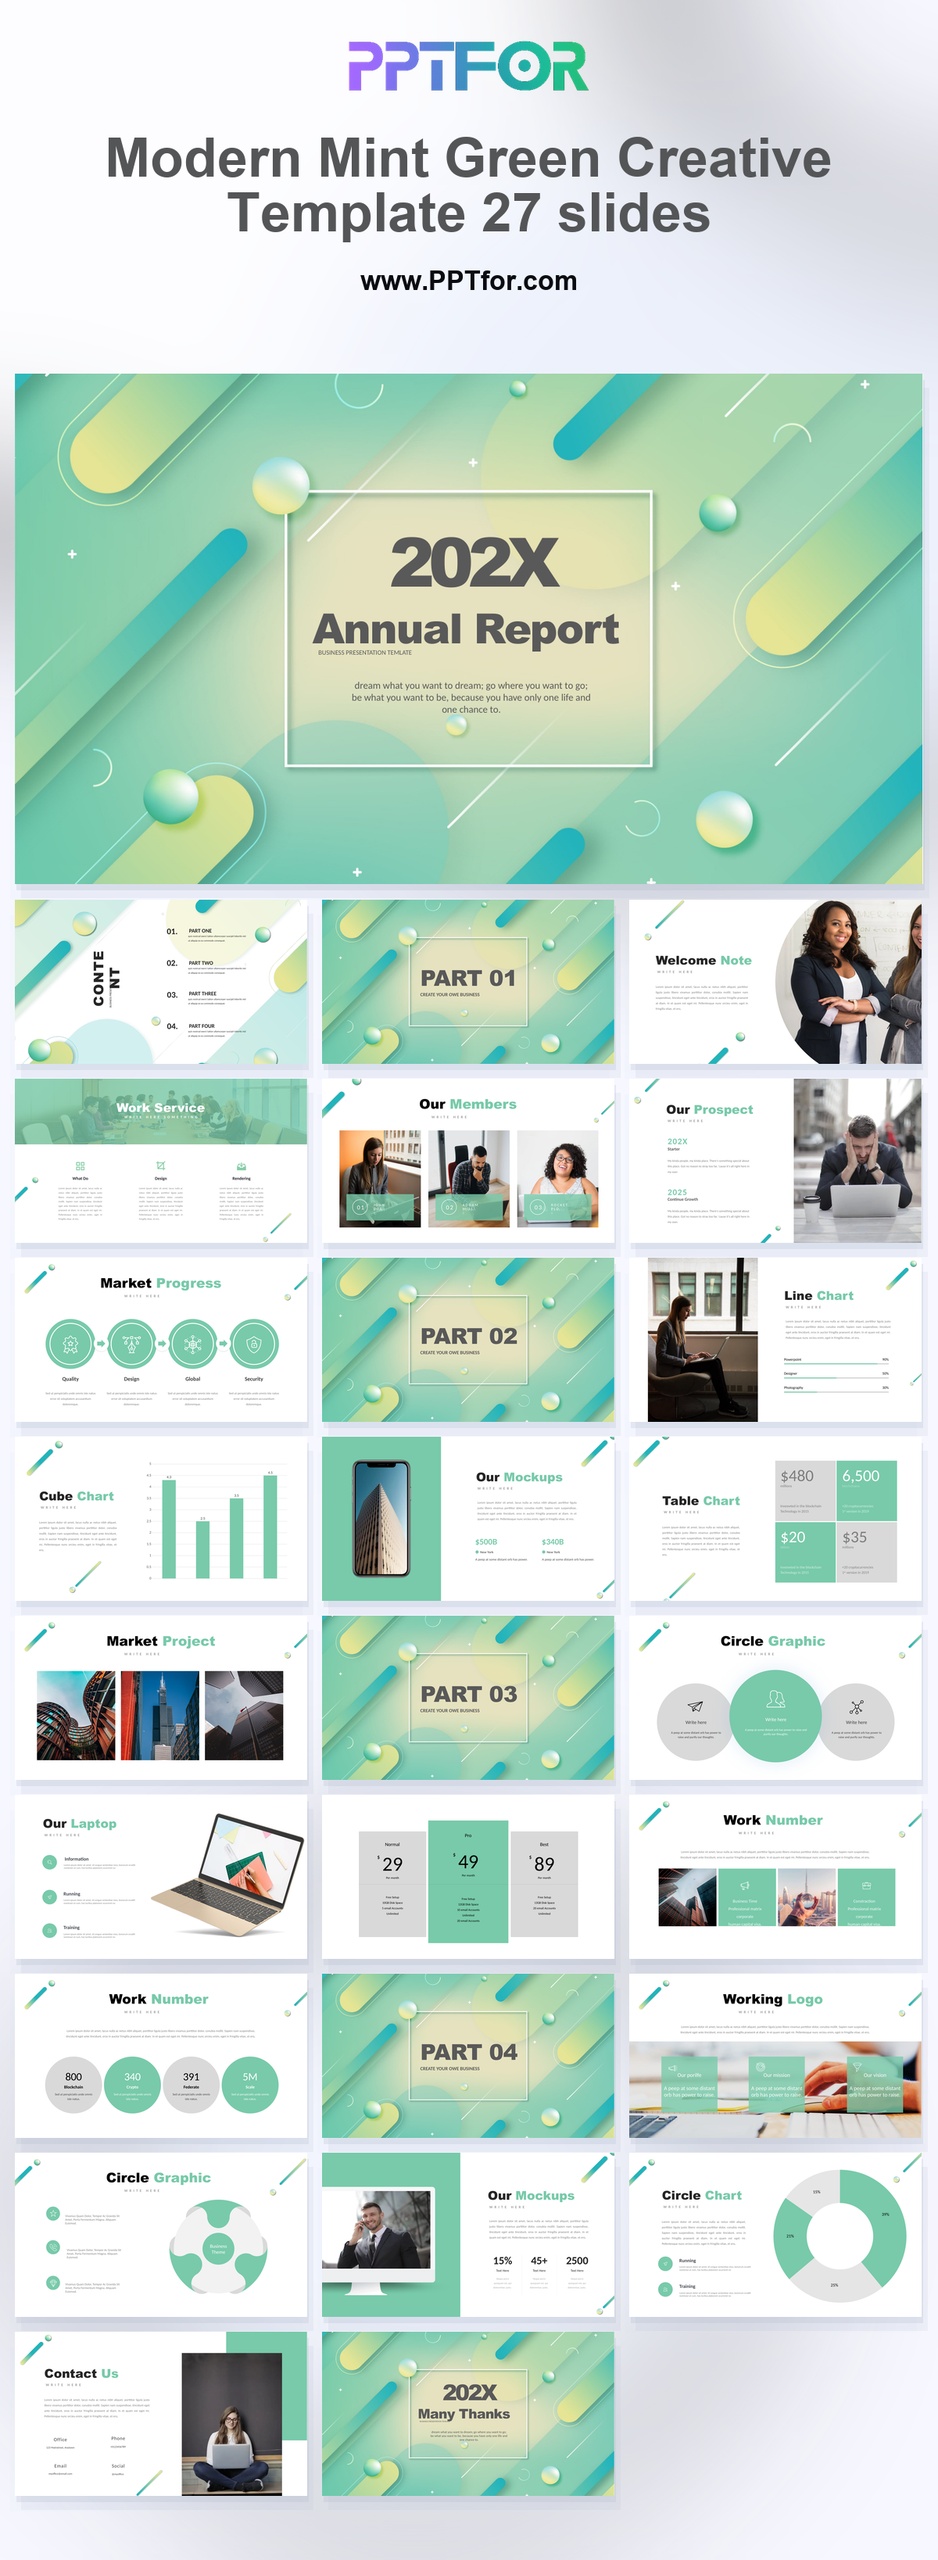
The Mint Green Annual Report PPT Template offers 27 slides for a year-end review, including team, service, progress, and chart layouts. Its mint palette provides a consistent style for reporting results and introducing the people behind them.
Visual elements include rounded diagonal pill shapes, glassmorphism elements, 3D spheres, clean grid layouts, and mint gradient backgrounds.
Choose this report when a short annual update needs business metrics alongside services and team content. Use the line and bar layouts for comparisons and reserve mockups for work that benefits from a visual example.
Prepare annual results, prior-period comparisons, team updates, and approved service images. Define the meaning of each chart series and keep the reporting year consistent across the presentation.
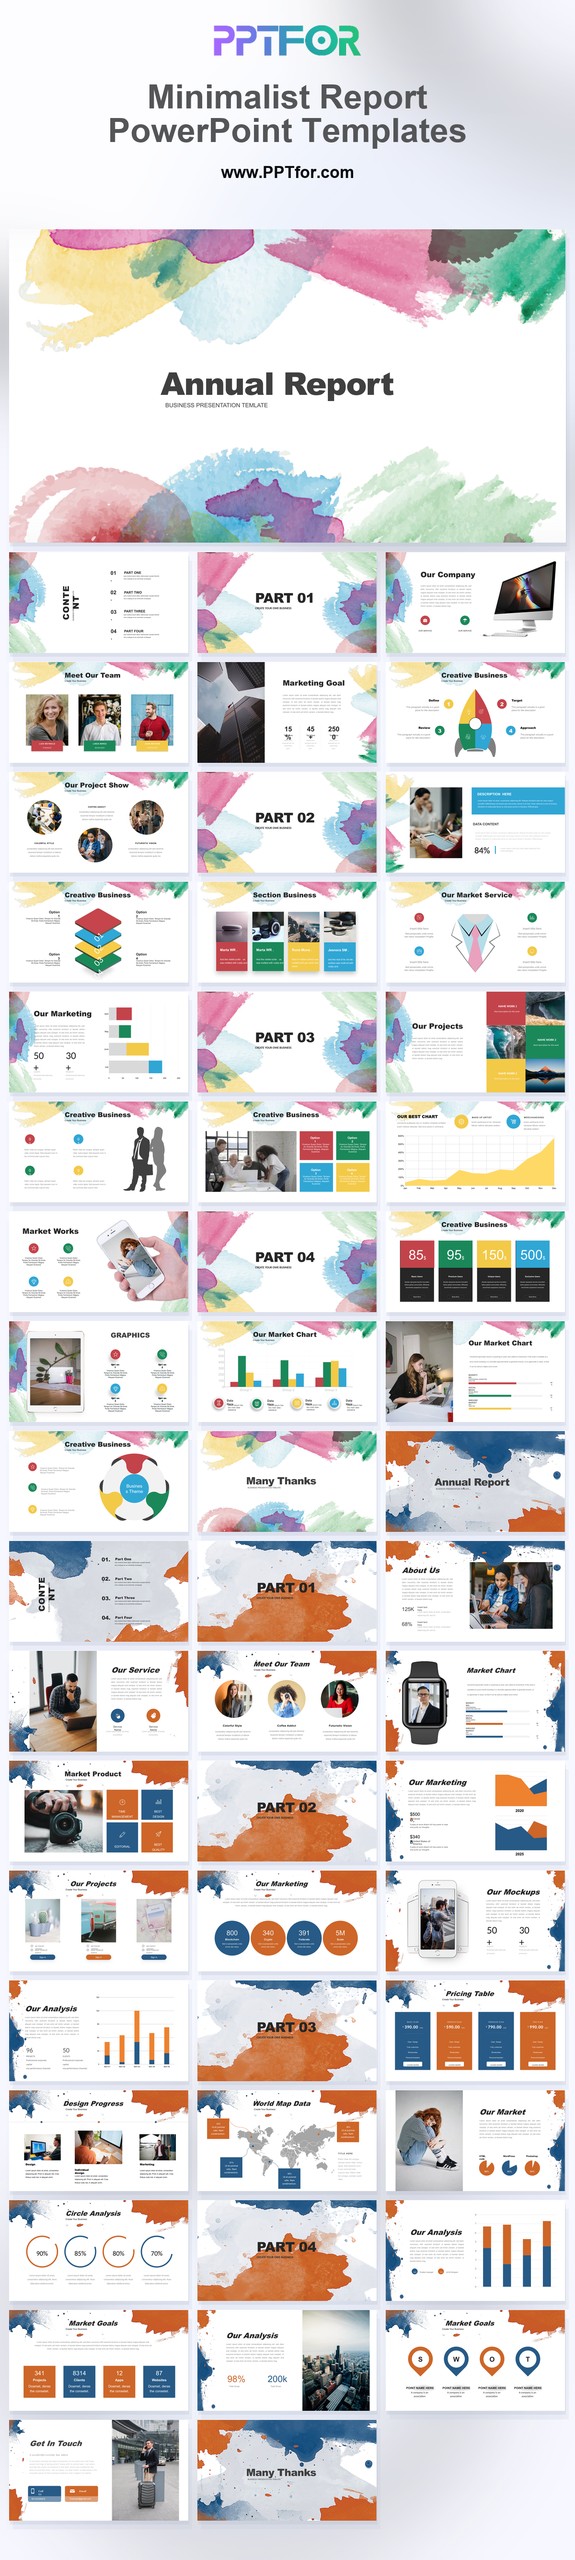
The deck includes an annual report cover, part transitions, welcome note, work service, team pages, market progress, line and bar charts, mobile and laptop mockups, pricing table, and work number infographics.
Edit the text, colors, and slide elements to match your presentation. Before updating a graphic, check whether it is a native chart, a grouped shape, or an image; the editing method differs.

Get full access to our entire collection of premium PPT templates for one simple price.
Forget about complex tools or technical skills—just choose, edit, and download.