Get full access to premium PowerPoint templates at a limited-time price.Get Now
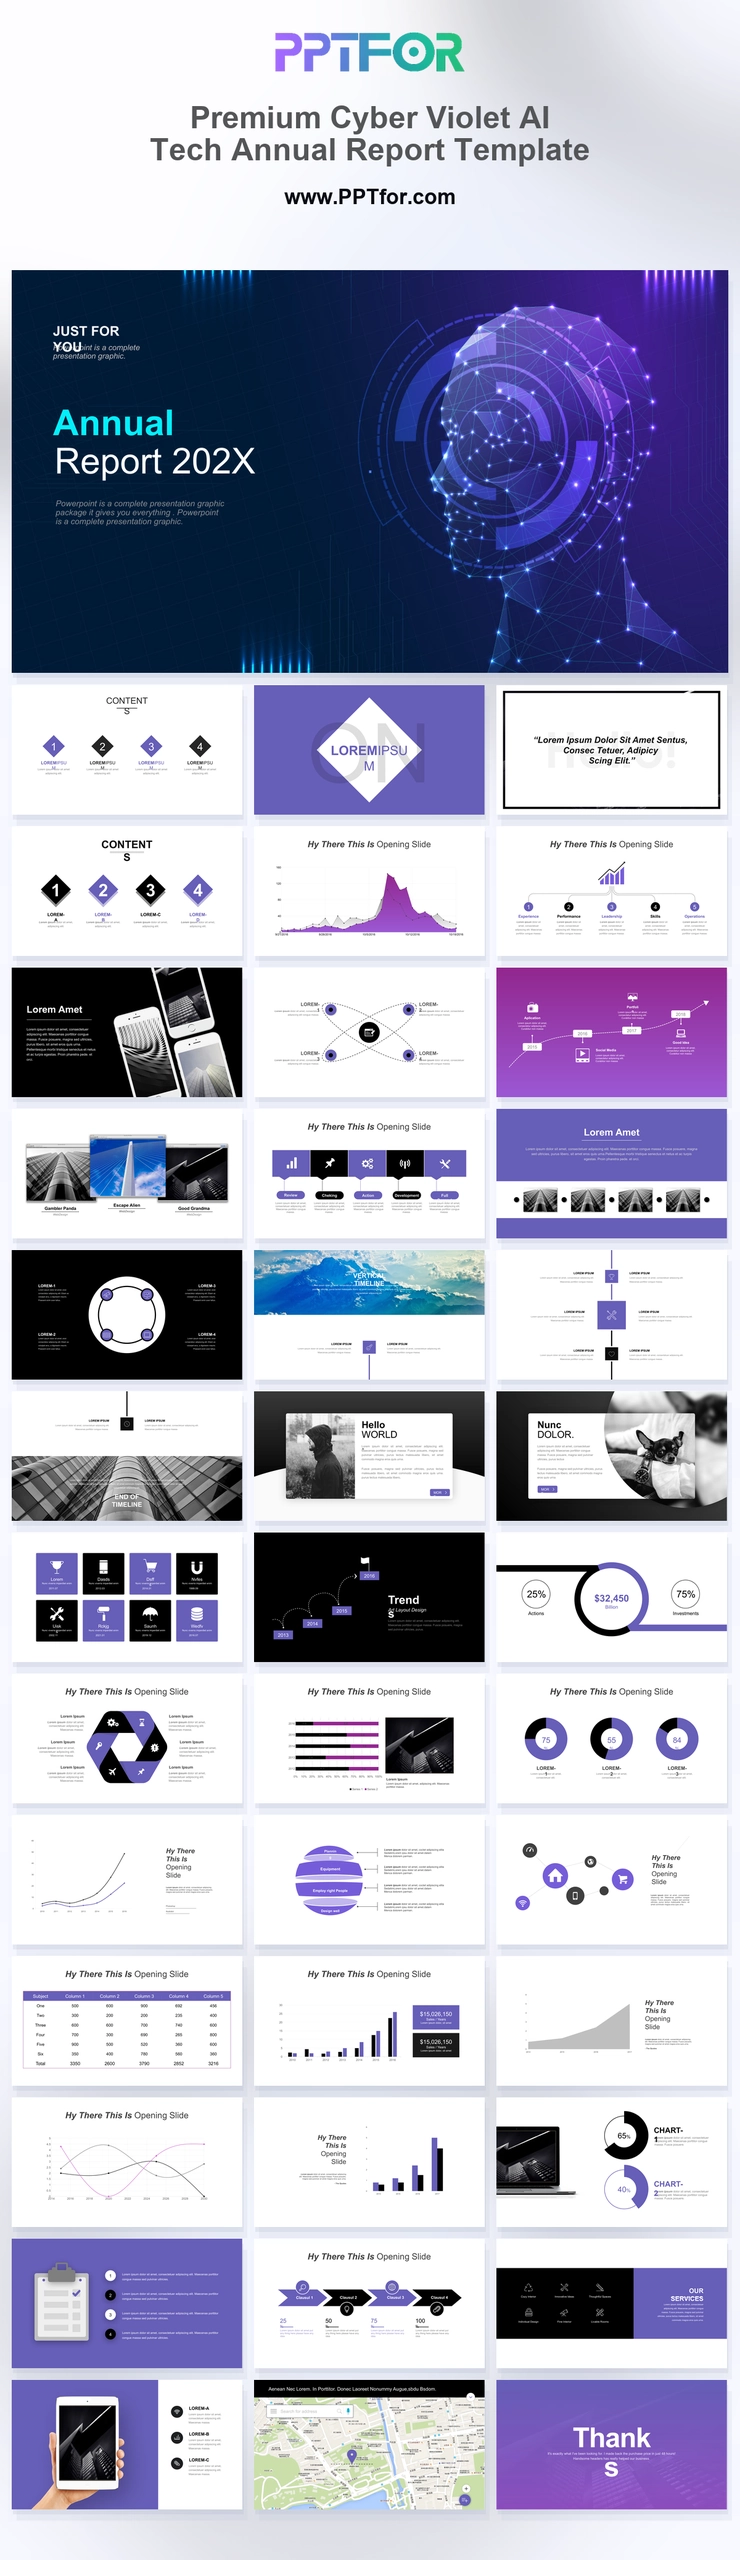
The Cyber Violet AI Tech Annual Report Template provides 36 slides with network imagery, process maps, comparison tables, and device mockups. Use it for a technology business review that explains product activity and annual performance.
Visual elements include a glowing digital network human head mesh profile, vertical neon lines, violet gradient panels, multi-phone clusters, and analytical area charts.
Choose this deck when its AI and network imagery matches the organization’s work. Describe specific technical capabilities and deployment status rather than using AI terminology as a substitute for product detail.
Prepare the reporting period, product releases, usage or operating metrics, and supported capability claims. Label demonstrations, estimates, and planned features separately from deployed functionality.
The deck includes a network head cover, contents agenda, violet area charts, process node maps, smartphone clusters, service grids, architectural hero panels, competency diagrams, comparison tables, laptop mockups, tablet layouts, city map geolocation, and a Thank You slide.
Edit the text, colors, and slide elements to match your presentation. Before updating a graphic, check whether it is a native chart, a grouped shape, or an image; the editing method differs.

Get full access to our entire collection of premium PPT templates for one simple price.
Forget about complex tools or technical skills—just choose, edit, and download.