 Get full access to premium PowerPoint templates at a limited-time price.Get Now
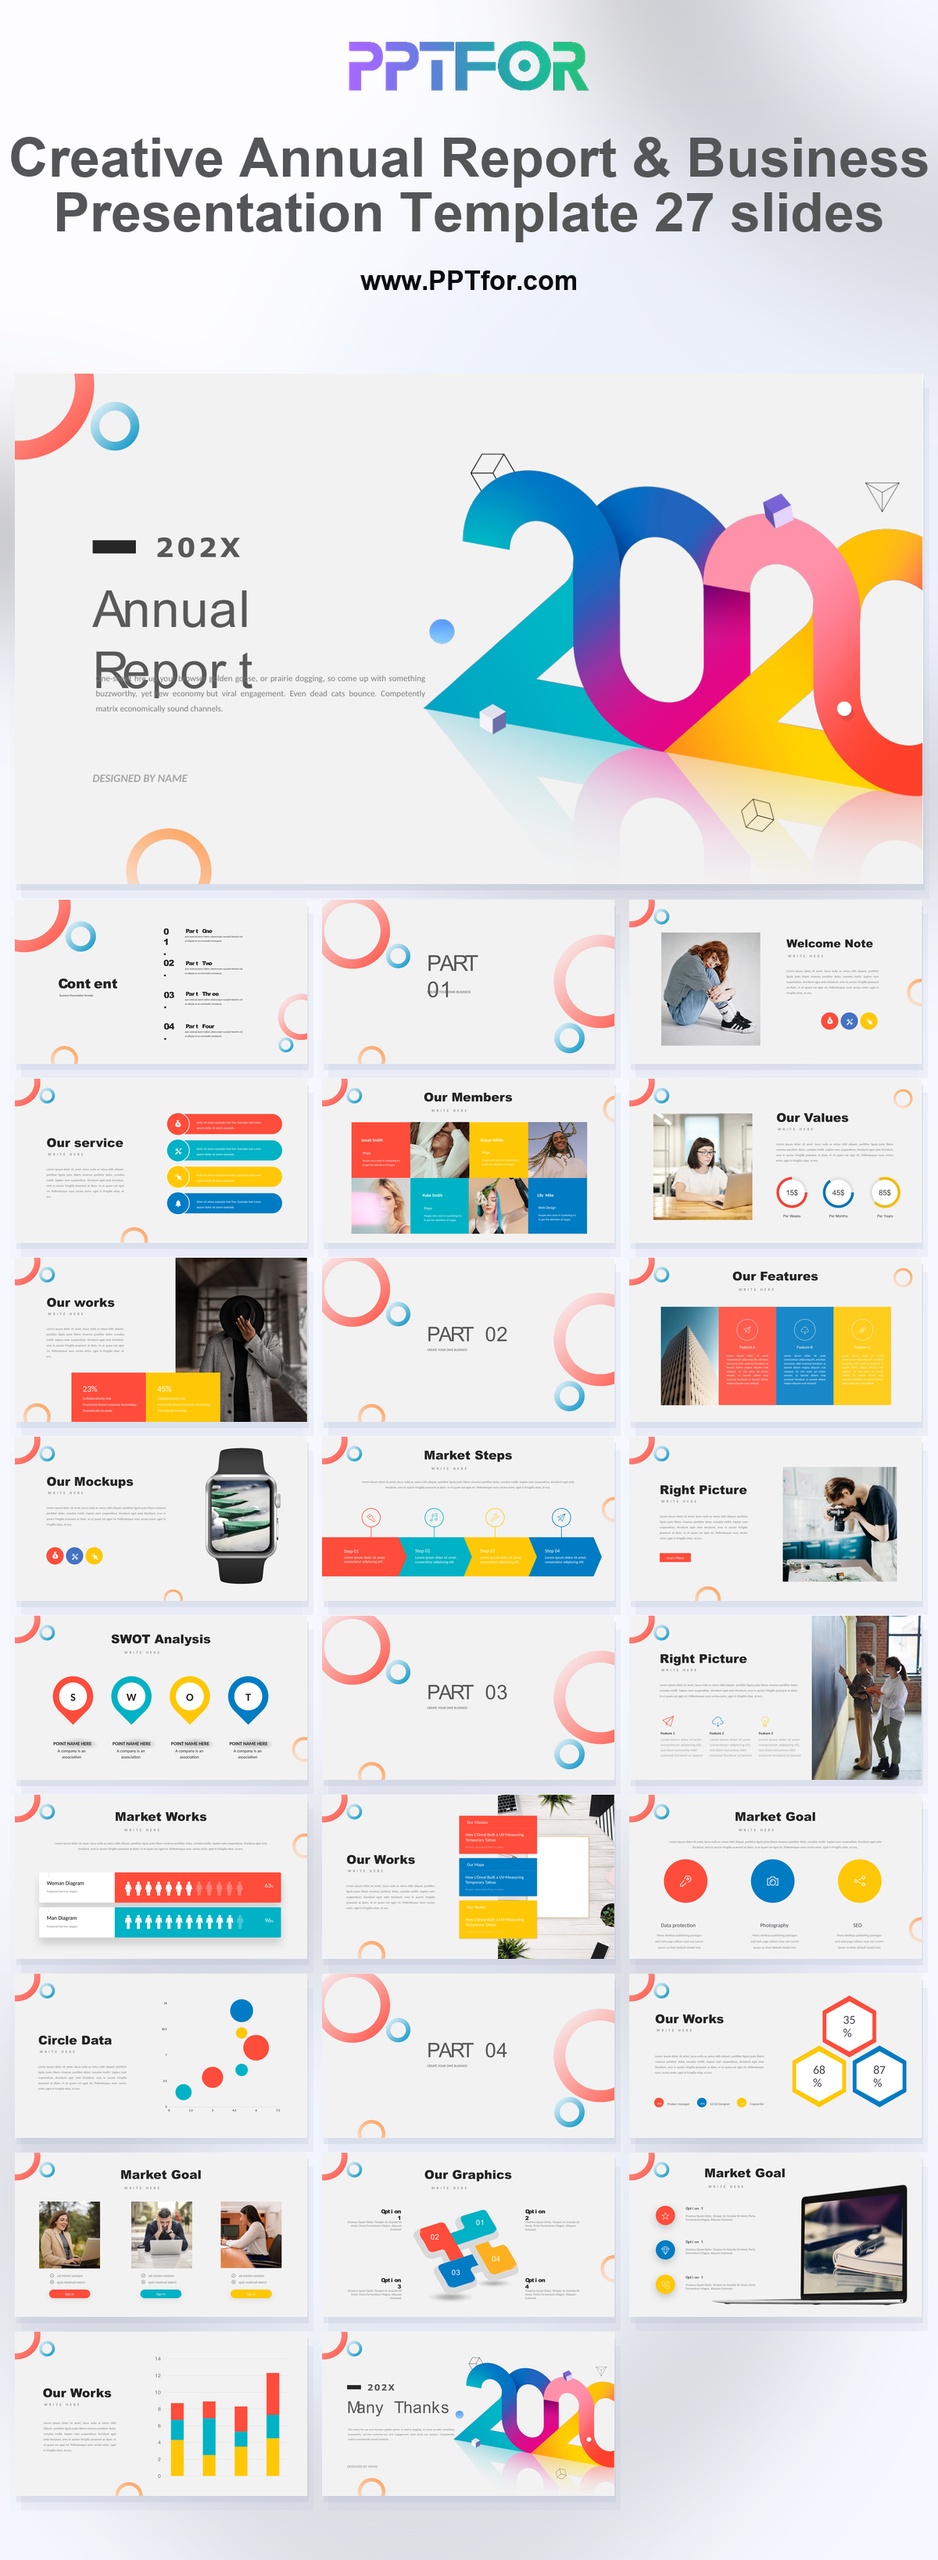
An annual marketing report PowerPoint template helps marketing teams summarize a full year of campaign performance, KPI progress, channel results, budget efficiency, and market insights in one structured presentation. Instead of showing every data point from the year, the goal is to explain what changed, what worked, and what the business should do next.
This guide breaks down the key slides to include in an annual marketing report presentation, from executive summaries and campaign results to market analysis and next-year priorities. If you want ready-made report layouts, explore PPTFOR’s Annual Report PowerPoint Templates and Market Analysis PowerPoint Templates.
An annual marketing report PowerPoint template is a presentation structure used to review marketing performance across a full year. It usually includes marketing goals, KPI results, campaign summaries, traffic and lead trends, budget usage, customer insights, and recommendations for the next year.
This template type gives CMOs, marketing managers, growth teams, agencies, and business leaders a clear way to connect marketing activity with business outcomes. A good annual marketing report does more than show metrics; it turns the year into a decision-ready story for stakeholders.
Annual marketing reports are useful for internal reviews, client reporting, executive updates, board meetings, and year-end planning sessions. The audience usually wants answers to practical business questions: Did marketing hit its goals? Which channels performed best? Where did the budget produce the strongest return? What should change next year?
For this reason, the best annual marketing report presentation should be easy to scan, visually organized, and focused on interpretation. Leadership does not need every campaign detail. They need the strongest findings, the business impact, and the next action.
A strong annual marketing report PowerPoint should cover the full performance story without becoming too long. These are the most useful slides to include:
The executive summary is the most important slide in the annual marketing report. It should give decision-makers a quick view of the year before they see the supporting data. Include three to five short points: top achievements, biggest challenges, major performance shifts, and recommended actions.
Keep this slide clear and selective. If everything is important, nothing is easy to act on. A strong executive summary helps senior leaders understand the marketing story before reviewing the details.
This slide should compare annual marketing goals with actual performance. Common KPIs include website traffic, organic search growth, lead volume, conversion rate, marketing qualified leads, sales pipeline contribution, customer acquisition cost, and campaign ROI.
Use simple visual comparisons instead of dense tables. For example, show target vs actual results, year-over-year change, or quarter-by-quarter progress. The purpose is to make performance easy to understand in a business review meeting.
The campaign performance section should explain which marketing initiatives created the strongest results. This may include product launches, seasonal promotions, paid advertising campaigns, content campaigns, webinars, email sequences, or account-based marketing programs.
For each major campaign, show the goal, audience, channel mix, results, and learning. This structure helps the report move beyond numbers and explain why certain campaigns succeeded or failed.
A channel breakdown helps teams see where marketing performance came from. You can compare SEO, paid ads, email marketing, social media, direct traffic, referral traffic, events, and partner campaigns.
Each channel should be judged by the metric that fits its role. SEO may be measured by traffic and qualified leads, while paid ads may be measured by cost per conversion and return on spend. This keeps the annual marketing report fair and useful.
Marketing performance does not happen in isolation. A strong annual marketing report should include market context so stakeholders understand why results changed. If search demand dropped, competitors became more aggressive, or customer priorities shifted, those changes should be explained.
This is where market analysis PowerPoint templates are especially useful. They help teams present competitor comparisons, audience segments, trend analysis, and market positioning in a format that supports better decision-making.
The budget section should show how marketing spend was used and what value it produced. Useful metrics include total spend, spend by channel, cost per lead, cost per acquisition, return on ad spend, pipeline influenced, and revenue attributed to marketing activity.
This slide is important because it connects marketing work to financial outcomes. It also helps leadership decide whether to increase, reduce, or reallocate budget for the next year.
The final section should turn the annual report into a plan. Summarize the key decisions for the next year: which channels deserve more investment, which campaigns should be repeated, which audiences need more focus, and which experiments should be tested.
An annual marketing report is most valuable when it leads to action. Use this section to connect performance insights with next-year strategy, team ownership, timelines, and budget priorities.
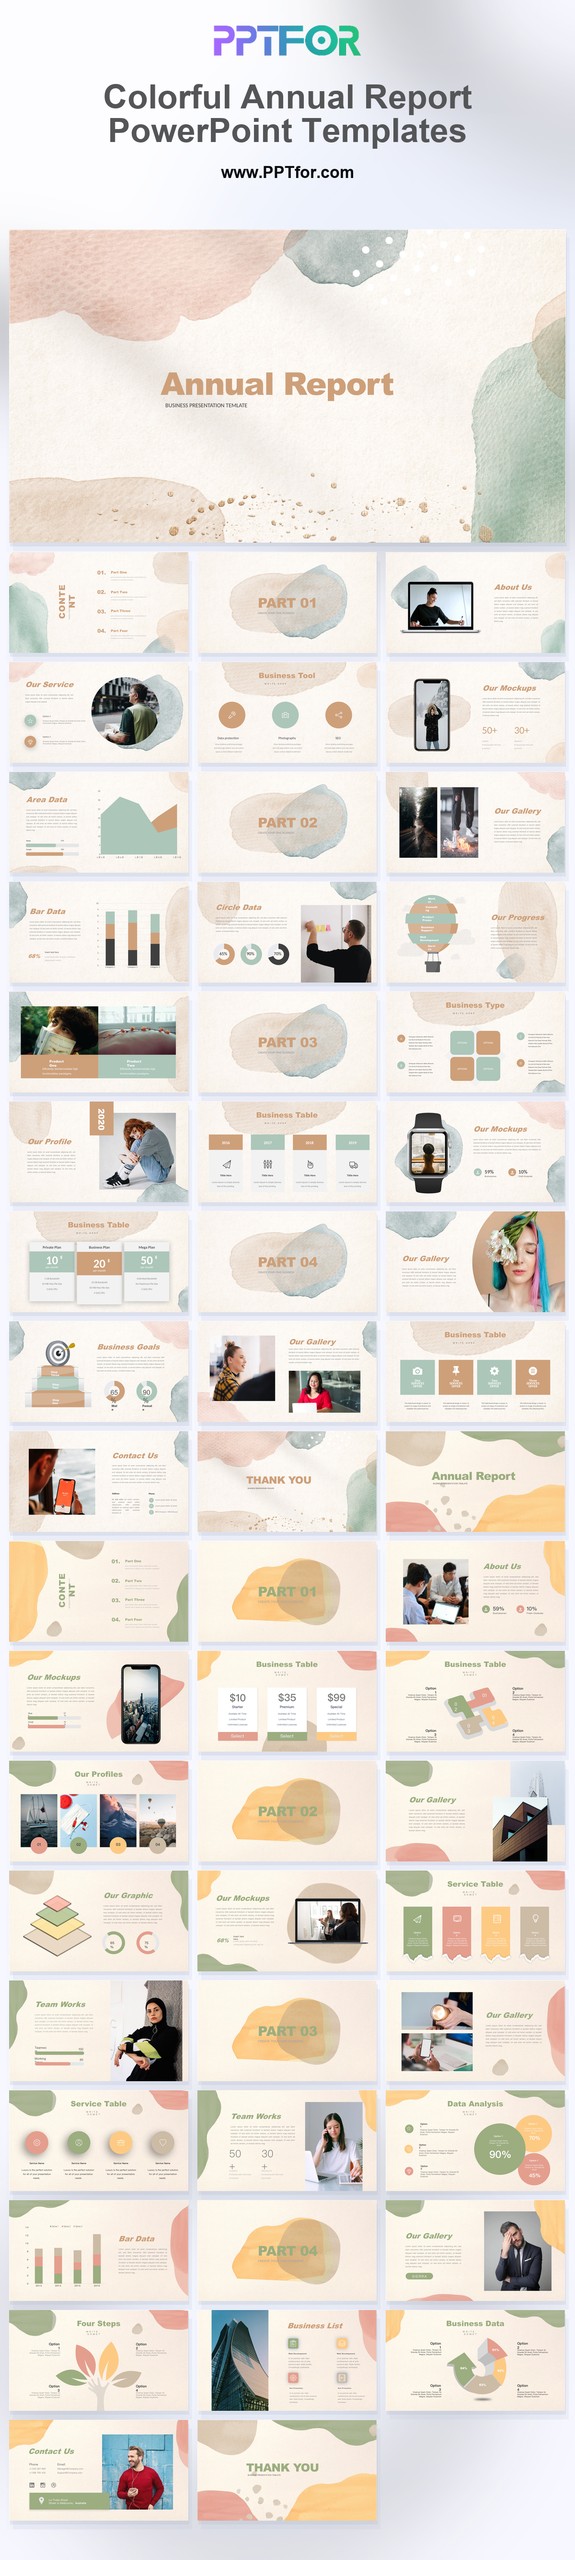
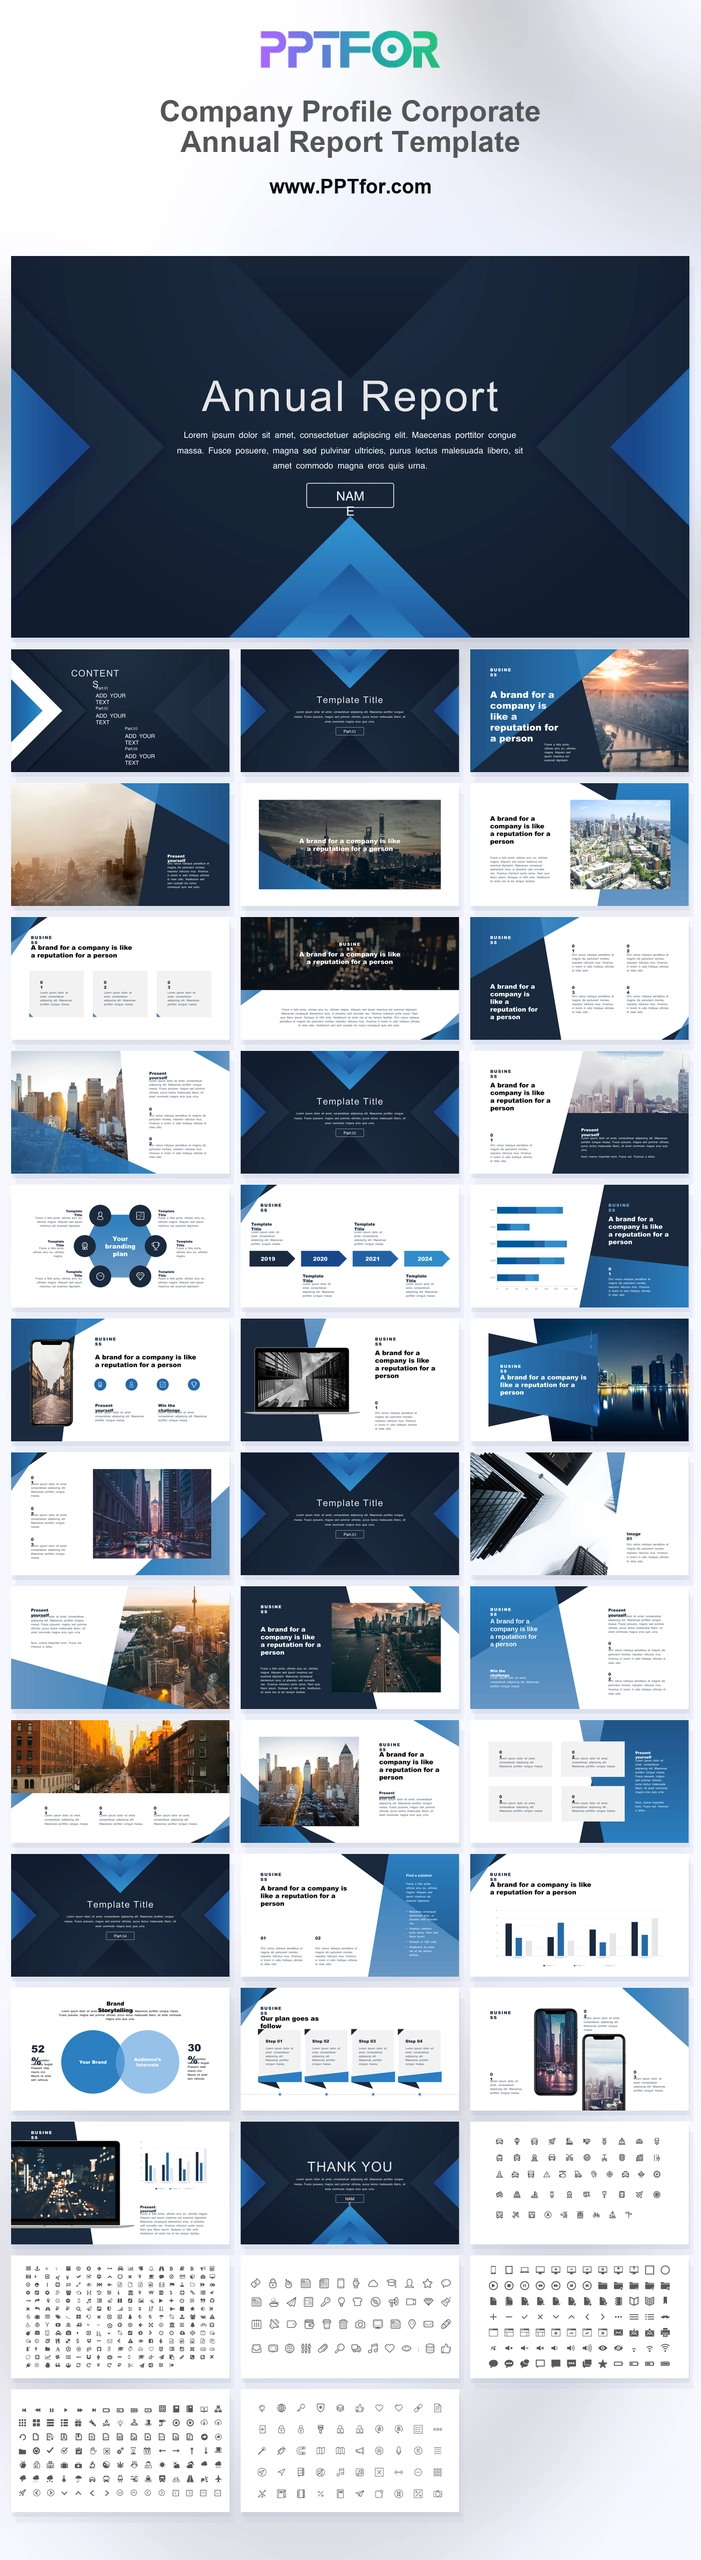
For an annual marketing report, choose presentation templates that support executive summaries, KPI dashboards, campaign reviews, market analysis, budget reporting, and strategy planning. PPTFOR’s annual report PowerPoint templates are useful for year-end business reviews, while market analysis templates can support competitor research and audience insight sections.
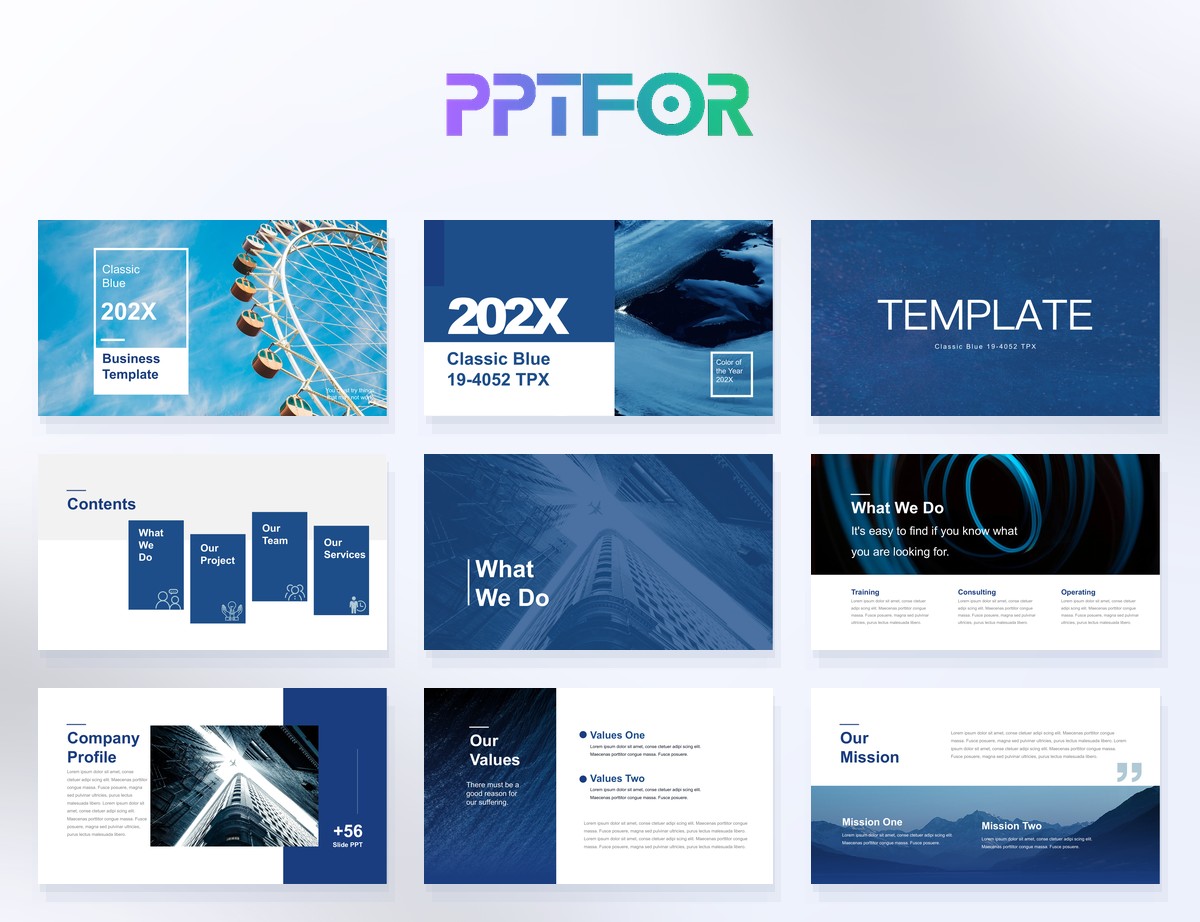
If the report is for a CMO, founder, agency client, or board-level audience, prioritize templates with clean reporting layouts, strong data sections, and room for concise recommendations. The best template should help the reader understand the year quickly, not just decorate the data.
Follow these steps to turn yearly marketing data into a focused annual report presentation.
An annual marketing report PowerPoint template should include an executive summary, marketing goals, KPI dashboard, campaign results, channel performance, budget review, market analysis, and next-year priorities. The exact slide count can vary based on the audience and reporting depth.
CMOs, marketing managers, growth teams, agencies, founders, and business consultants use annual marketing report presentations to explain yearly performance, review campaign impact, align stakeholders, and plan the next year’s marketing strategy.
A monthly report focuses on short-term performance, and a quarterly report reviews recent progress. An annual marketing report looks at the full year, connects results to business goals, and usually includes broader market insights and next-year planning.
Yes. An annual report template can work well for marketing reports if it includes sections for KPIs, campaign summaries, budget review, market analysis, and recommendations. Choose a layout that supports both data and business storytelling.

Get full access to our entire collection of premium PPT templates for one simple price.
Forget about complex tools or technical skills—just choose, edit, and download.