Get full access to premium PowerPoint templates at a limited-time price.Get Now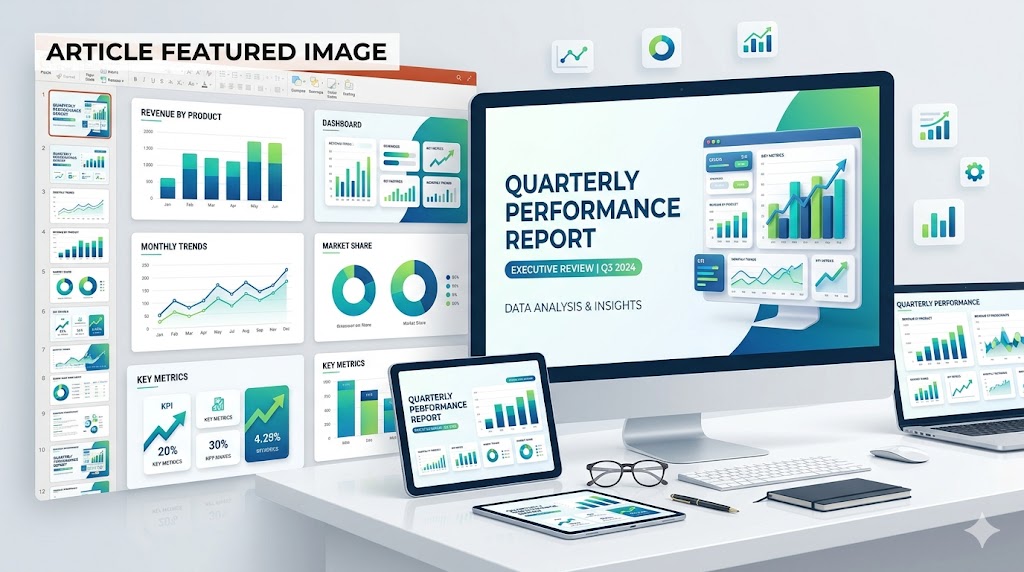
A quarterly report PowerPoint template is a ready-to-edit presentation deck used to summarize business performance over a three-month period. It helps teams present KPIs, financial results, project updates, risks, wins, and next-quarter priorities in a clear format for executives, clients, investors, or internal stakeholders.
The best quarterly report templates do more than make slides look polished. They help you explain what happened, why it happened, what changed, and what the business should do next.
If you need a ready-made Quarterly Report PowerPoint Template, choose an editable PPTX deck with KPI dashboard slides, financial summary layouts, quarterly performance charts, project update pages, and next-quarter planning slides. A good template should work in PowerPoint and Google Slides and be easy to customize for executive, client, and internal business reviews.
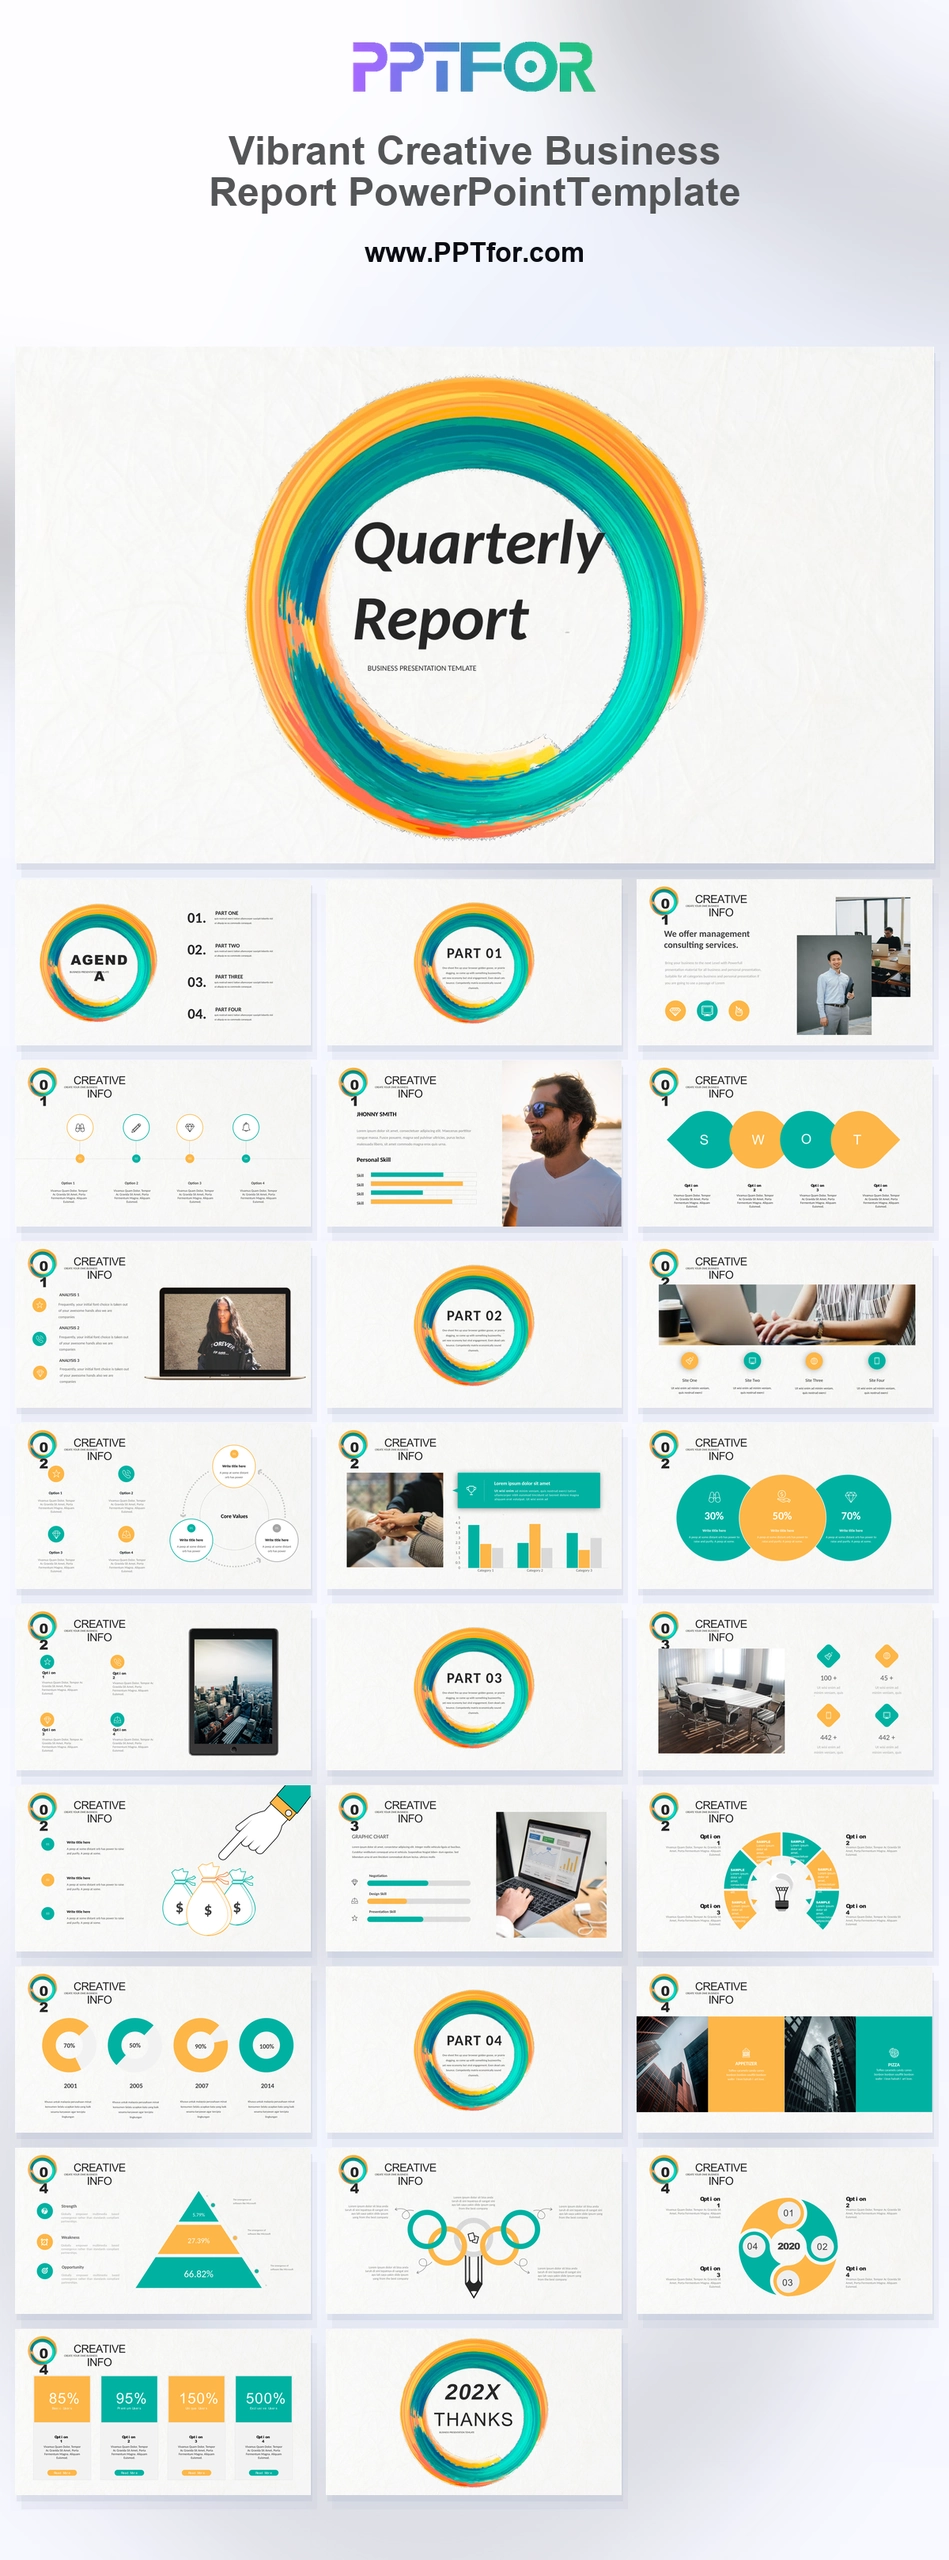
For a ready-to-edit design, you can use the Vibrant Creative Quarterly Report PowerPoint Template as a practical starting point for quarterly business reports, KPI reviews, and performance presentations.
A strong quarterly report PowerPoint template should include an executive summary, KPI dashboard, financial overview, performance analysis, project updates, risks and challenges, key wins, next-quarter goals, and action items. For executive audiences, the deck should usually stay between 10 and 20 slides.
| Slide | Purpose | Best For |
|---|---|---|
| Cover Slide | Introduces the report period, team, company, or client | All quarterly reports |
| Executive Summary | Shows the quarter’s most important outcomes in one slide | Executives, board members, clients |
| KPI Dashboard | Displays the main metrics used to judge performance | Leadership reviews, business updates |
| Financial Performance | Compares revenue, expenses, profit, budget, or forecast | Finance, investors, management |
| Project Updates | Shows completed work, delayed work, and in-progress initiatives | Operations, product, marketing, agencies |
| Risks and Challenges | Explains blockers, missed targets, or business risks | Decision-makers |
| Next-Quarter Plan | Defines goals, priorities, owners, and timelines | Every quarterly review |
| Action Items | Turns the review into clear follow-up tasks | Teams and client meetings |
A quarterly report PowerPoint template is an editable PPT or PPTX file designed to present business performance for one quarter. It usually includes pre-built layouts for charts, data summaries, timelines, status updates, comparison tables, and next-step planning.
Companies use quarterly report templates for internal business reviews, quarterly business reviews, sales reports, financial updates, marketing performance reports, client presentations, board updates, and department planning sessions.
For public companies, formal quarterly reporting may also involve regulatory filings such as Form 10-Q. A PowerPoint quarterly report is different. It is usually a communication deck designed to make performance easier to understand and discuss.
A quarterly report template and a QBR template are similar, but they are not always used for the same purpose.
| Template Type | Main Focus | Typical Audience |
|---|---|---|
| Quarterly Report Template | Performance summary, KPIs, financials, status updates | Internal teams, executives, managers, boards |
| QBR Template | Business value, strategic progress, client outcomes, next steps | Clients, partners, customer success teams, leadership |
| Quarterly Business Review Template | Quarterly outcomes, business value, roadmap progress, renewal discussion | Customer success teams, consultants, client-facing teams |
| Quarterly Financial Report Template | Revenue, profit, expenses, budget, forecast, financial trends | Finance teams, investors, executives |
| Quarterly Project Report Template | Milestones, deliverables, timelines, blockers, resource needs | Project managers, operations teams, stakeholders |
Use a quarterly report template when the goal is to summarize results. Use a QBR template or quarterly business review template when the goal is to review business value and agree on future priorities.
Use this step-by-step process to turn a quarterly report PPT template into a clear business review presentation. The goal is to connect quarterly data with decisions, not simply place numbers on slides.
If you are building a quarterly report deck from scratch, use this structure as a practical starting point:
A good quarterly report PowerPoint template should be clear, editable, data-friendly, and easy to present. It should help the audience understand the quarter quickly without forcing them to decode crowded charts or long paragraphs.
Microsoft recommends checking slide reading order and accessibility when preparing PowerPoint files, especially when presentations are shared widely or exported as PDFs. You can review Microsoft’s guidance on PowerPoint reading order and accessibility.
The right quarterly report template depends on your audience, your data, and the decision you want the presentation to support.
| Use Case | Best Template Style | Key Slides to Include |
|---|---|---|
| Executive update | Clean, concise, KPI-focused | Summary, dashboard, risks, priorities |
| Client QBR | Strategic and outcome-focused | Results, value delivered, recommendations, roadmap |
| Financial review | Data-heavy and chart-focused | Revenue, expenses, margin, forecast |
| Marketing report | Visual and campaign-focused | Traffic, leads, conversions, campaign ROI |
| Sales report | Pipeline and target-focused | Bookings, pipeline, win rate, forecast |
| Project status report | Timeline and milestone-focused | Progress, blockers, milestones, next steps |
Quarterly data becomes useful when it is connected to a clear interpretation. Do not show a chart without explaining the takeaway.
For every major chart, answer three questions:
For example, instead of writing “Revenue increased this quarter,” write “Revenue increased 12% compared with last quarter, mainly due to higher enterprise sales and improved renewal performance.” This makes the slide easier for executives, clients, and AI search systems to understand.
Many quarterly report presentations fail because they show too much information without enough interpretation. A template should simplify the story, not turn the deck into a spreadsheet.
A free quarterly report PowerPoint template is a good choice for simple internal updates, one-time reports, or early-stage teams that need a quick structure. A premium template is usually better for recurring executive reports, client-facing QBRs, investor updates, and branded presentations.
| Option | Pros | Best For |
|---|---|---|
| Free Template | Fast, simple, low cost | Internal reports, quick updates, basic dashboards |
| Premium Template | More layouts, better visuals, stronger polish | Client reports, board decks, recurring QBRs |
| Custom Template | Brand-specific, reusable, tailored to your metrics | Large teams, agencies, enterprise reporting |
A quarterly report PowerPoint template is an editable presentation deck used to summarize business performance over a three-month period. It typically includes slides for KPIs, financial results, project updates, risks, wins, and next-quarter plans.
Most quarterly report presentations should have 10 to 20 slides. Executive reports should be shorter and more focused, while operational reports may include more detailed supporting slides.
A quarterly report summarizes performance and status for a quarter. A QBR, or quarterly business review, is usually more strategic and focuses on business value, outcomes, client goals, and future priorities.
The metrics depend on the business function, but common quarterly report metrics include revenue, profit margin, expenses, customer growth, churn, pipeline, conversion rate, project completion rate, campaign ROI, and customer satisfaction.
Yes. Many PPT and PPTX quarterly report templates can be opened in Google Slides. However, some fonts, animations, icons, and advanced chart formatting may need manual adjustment after import.
Quarterly report templates are used by executives, finance teams, marketers, sales leaders, customer success managers, project managers, consultants, agencies, and department heads.
The best quarterly report template for executives is concise, KPI-focused, and decision-oriented. It should include an executive summary, goals versus results, key risks, major insights, and next-quarter priorities.
A Quarterly Report PowerPoint Template helps teams turn quarterly data into a clear business story. The best templates combine KPI dashboards, financial summaries, progress updates, risks, and next-quarter plans in a format that is easy to edit and easy to present.
If your quarterly report is meant for executives, keep it concise. If it is meant for clients, focus on value and outcomes. If it is meant for internal teams, make the next steps clear. A strong quarterly report does not just explain the past quarter. It helps the audience make better decisions for the next one.

Get full access to our entire collection of premium PPT templates for one simple price.
Forget about complex tools or technical skills—just choose, edit, and download.