Get full access to premium PowerPoint templates at a limited-time price.Get Now
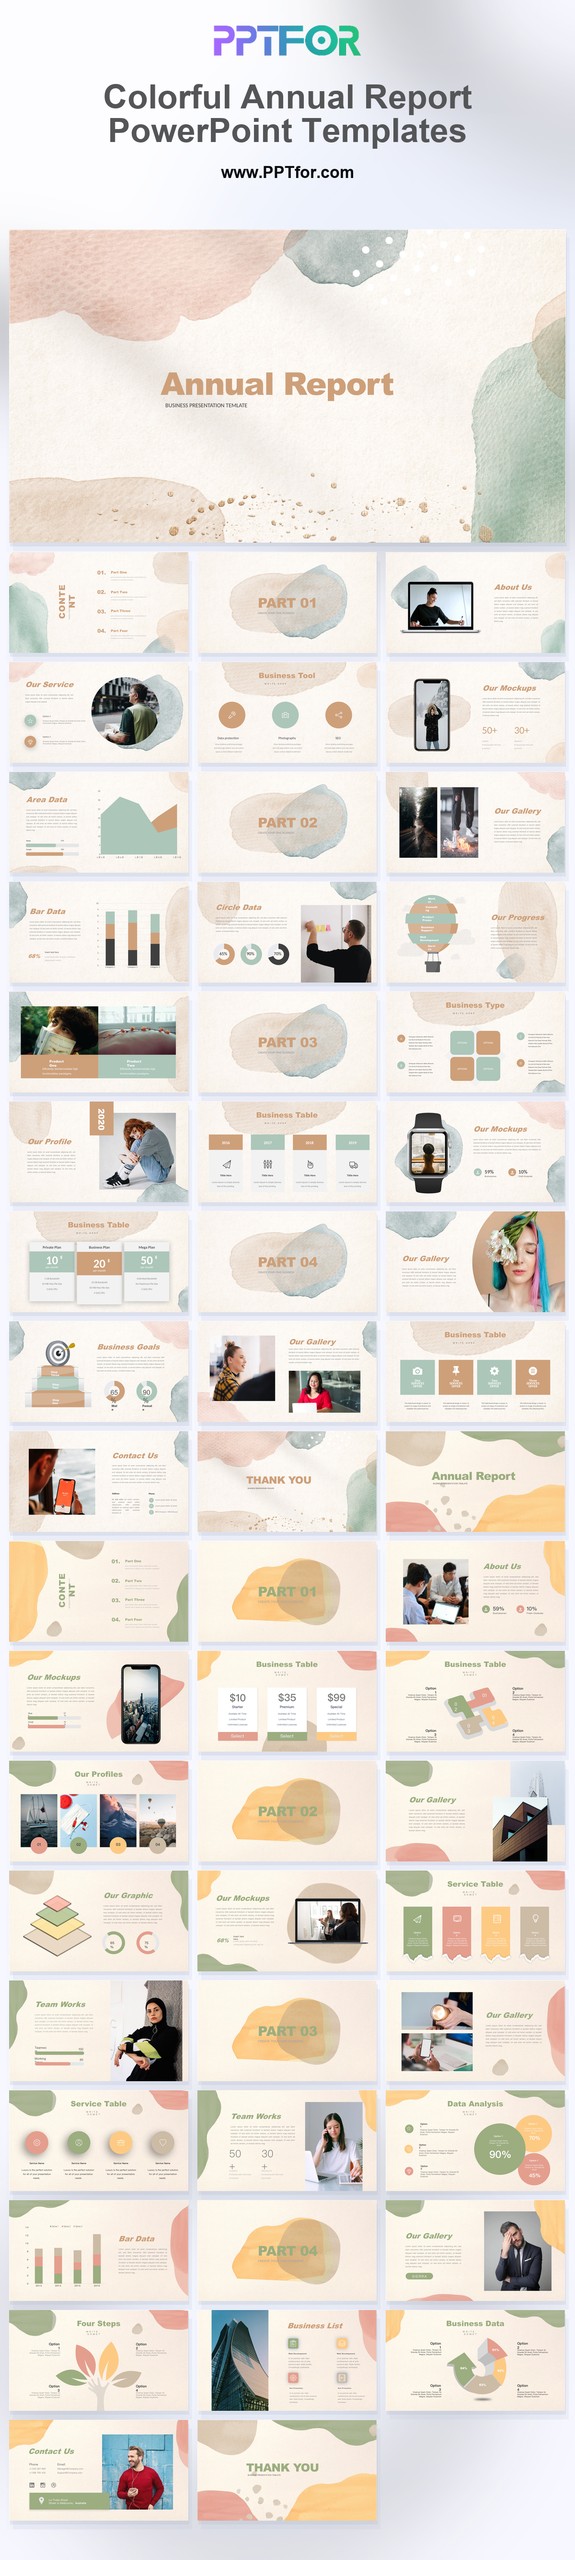
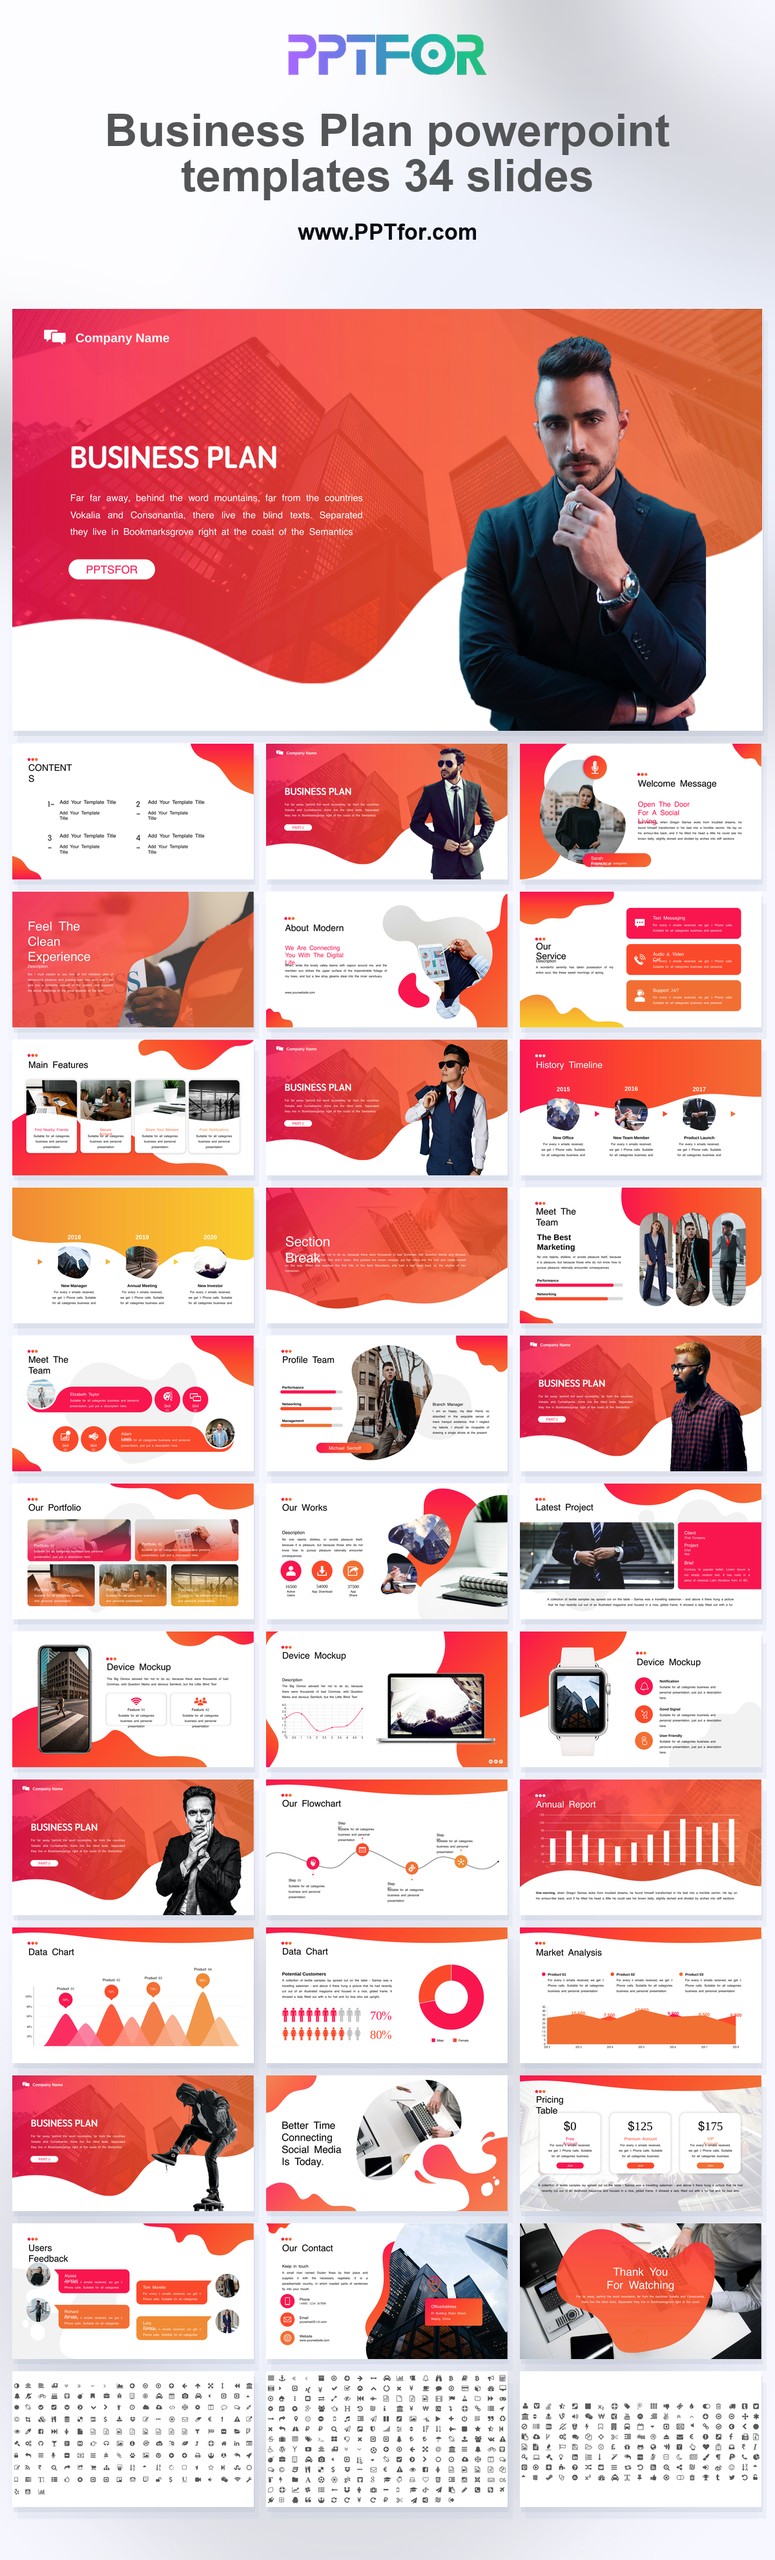
Business report PowerPoint templates help managers, analysts, finance teams, project leaders, and consultants present performance clearly and move a meeting toward decisions. Use this collection for monthly and quarterly reviews, financial reporting, project status updates, client reports, management presentations, and executive summaries.
The best report template depends on the reporting question. A monthly operating review needs trends and exceptions, while a project report needs milestones, risks, and ownership. These editable templates provide structured starting points, but each product has different layouts, slide counts, and visual styles. Review the product details before choosing a deck.
An effective business report shows the current result, compares it with a target or prior period, explains the main drivers, identifies risks, and assigns next actions. It should not be a collection of charts without interpretation. Every section should help the audience understand what happened and what should happen next.
| Report type | Core questions | Useful slides |
|---|---|---|
| Executive report | What changed, why, and what needs a decision? | Summary, KPI trends, risks, decisions |
| Financial report | How did results compare with plan? | P&L summary, variance, cash, forecast |
| Project status report | Are scope, time, cost, and risks controlled? | RAG status, milestones, risks, actions |
| Marketing report | Which channels and campaigns drove outcomes? | Funnel, ROI, channel trends, next tests |
| Client report | What was delivered and what value resulted? | Objectives, work completed, results, recommendations |
A dashboard monitors metrics, often continuously. A report explains a defined period or issue, including context, causes, conclusions, and recommended actions.
Executive reports often need 6 to 12 main slides. Detailed operational or client reports may require more, with supporting data placed in an appendix.
State the result clearly, compare it with the target, explain verified drivers, identify the impact, and present a practical corrective action with an owner and date.
Yes, if its layouts support repeatable KPI definitions, trends, commentary, risks, and action tracking. Keep the structure stable so readers can compare periods quickly.
Get full access to our entire collection of premium PPT templates for one simple price.
Forget about complex tools or technical skills—just choose, edit, and download.