 Get full access to premium PowerPoint templates at a limited-time price.Get Now
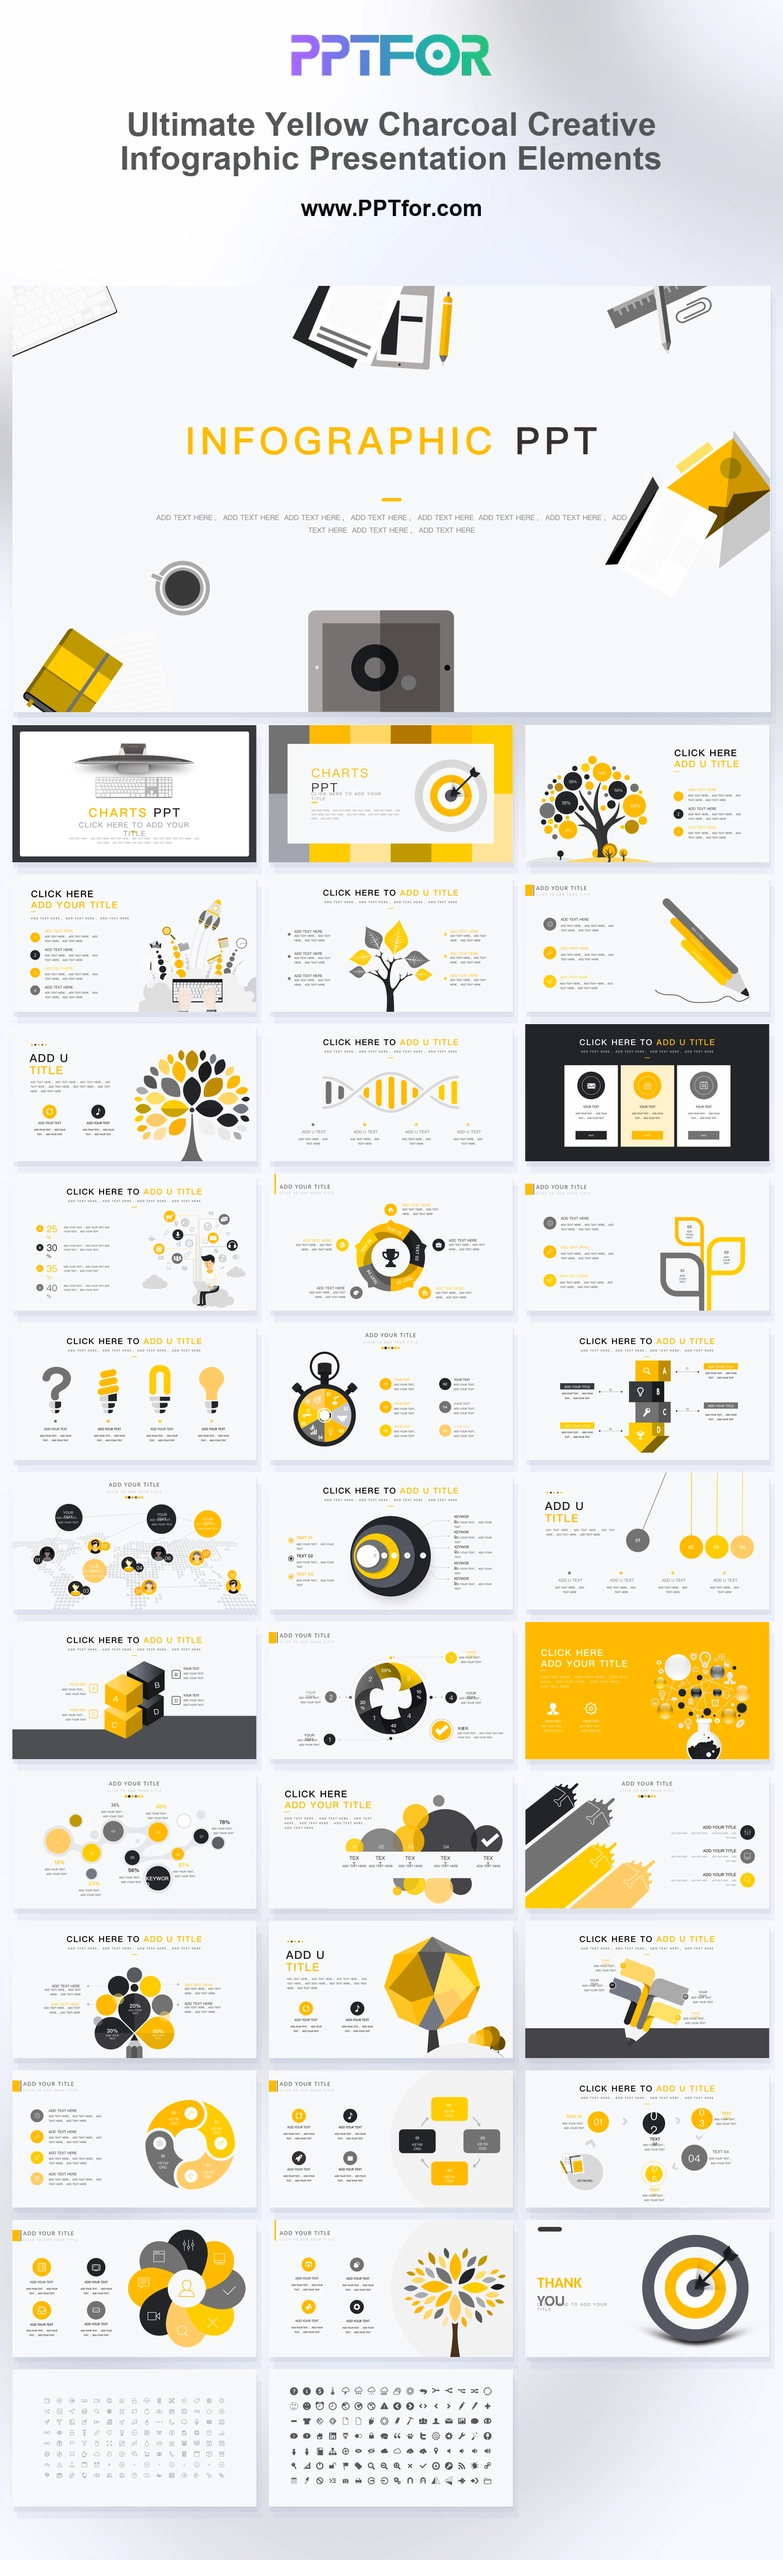
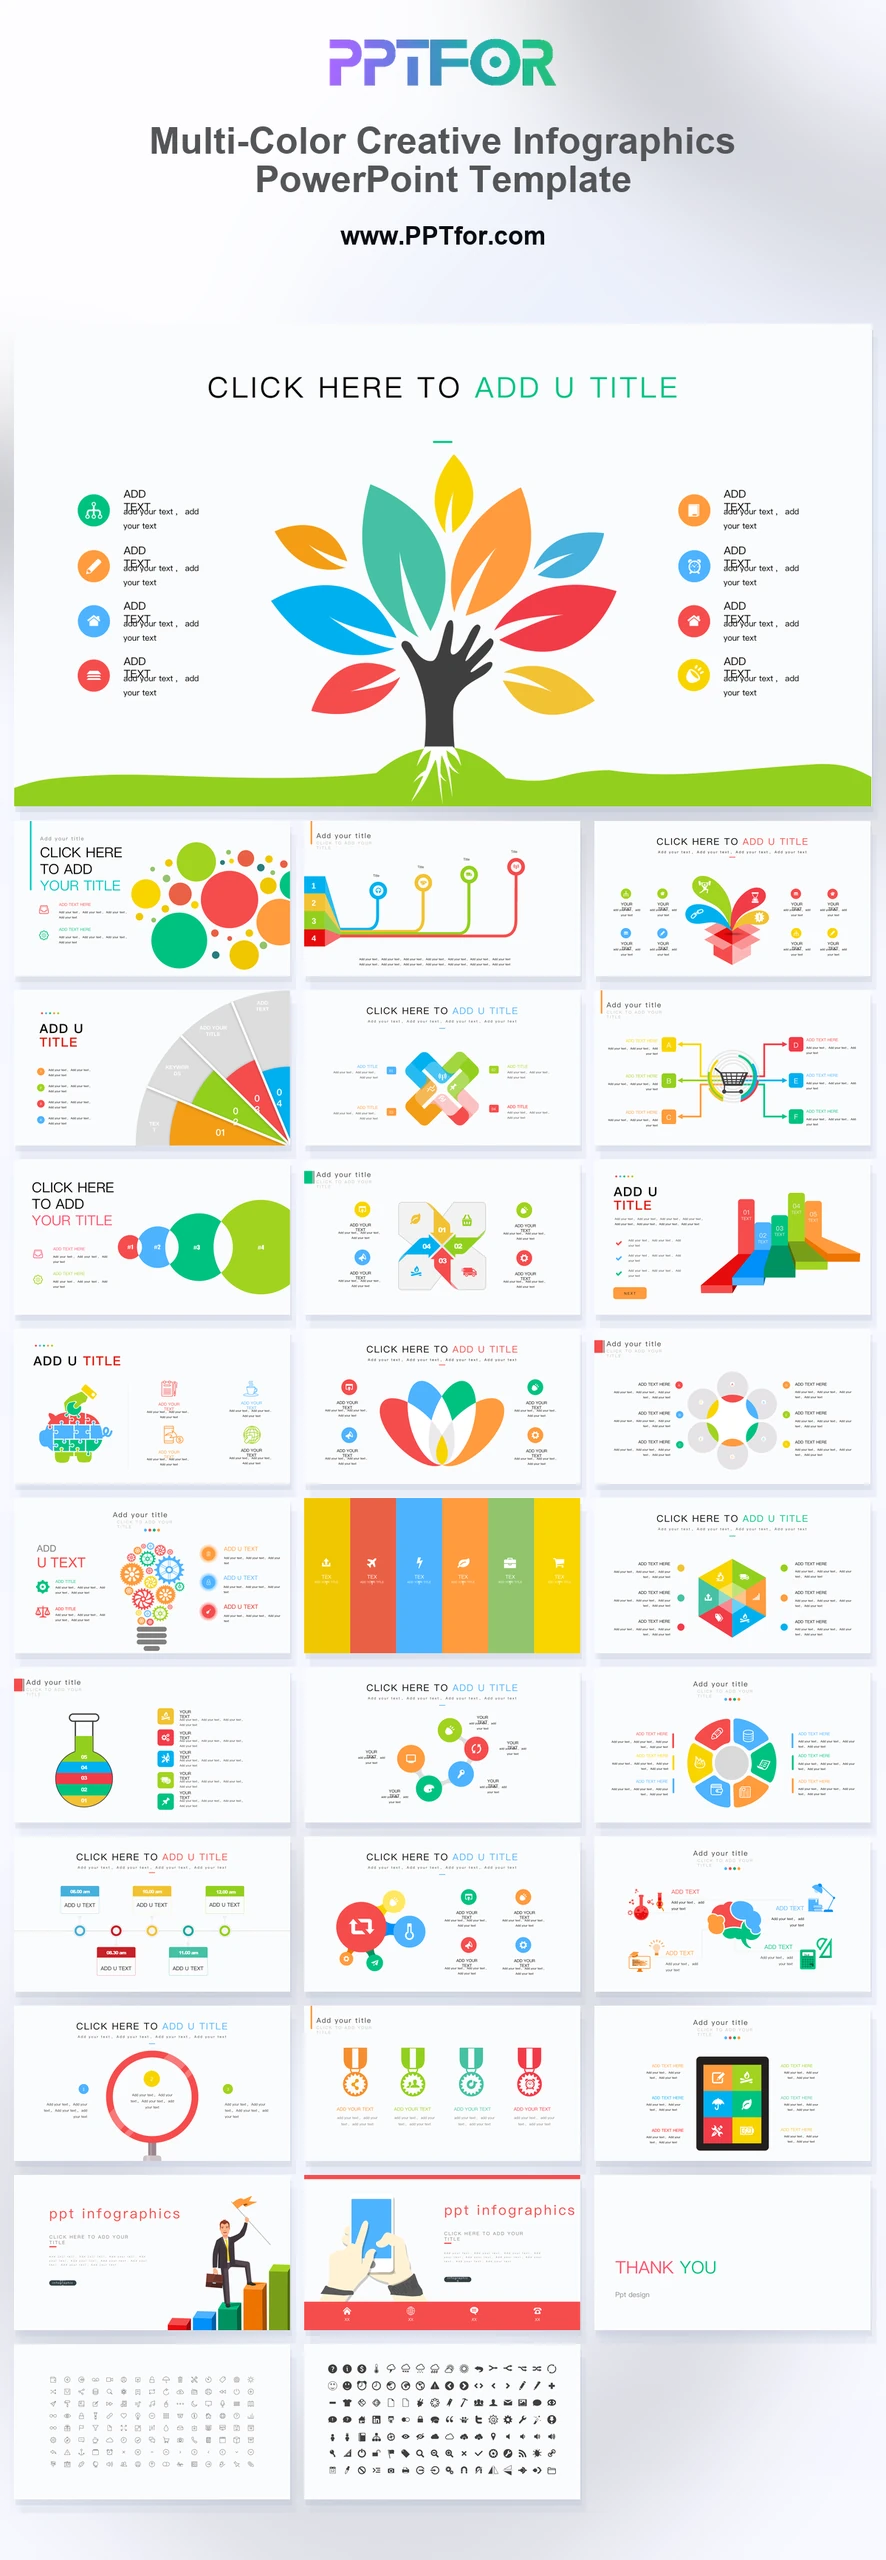
Use these Ultimate Yellow and Charcoal Creative Infographic Presentation Elements for data visualization, roadmapping, and training in 36 slides.
The Ultimate Yellow and Charcoal Creative Infographic Presentation Elements give business analysts, project managers, marketing strategists, corporate trainers, and creative leads a 36-slide system for complex data visualization, strategic roadmapping, competency analysis, training workshops, and milestone tracking. Flat growth data trees, golden DNA strand models, target bullseye graphics, circular pie loops, pendulum nodes, puzzle steps, and lightbulb frameworks create a clean flat-design language for management consulting, digital agencies, education technology, financial asset research, and technology startups. The Vibrant Yellow, Deep Charcoal, Soft Gray, and Minimalist White palette supports attention, authority, structure, and readable contrast across bullseye overviews, data tree networks, feature matrices, system loops, time metrics, funnels, hexagonal crystals, world maps, stacked steps, flower process nodes, and micro-icons. Template compatibility includes Microsoft PowerPoint, Google Slides, and Apple Keynote, with editable vector shapes, iconography, drag-and-drop placeholders, and customizable slides, colors, fonts, and layouts. Customize these elements now and turn dense business logic into cleaner visual decision slides.
These elements are best used for data visualization, strategic roadmapping, competency analysis, training workshops, and project milestone tracking when teams need functional business slides with a clean flat-design look.
Business analysts, project managers, marketing strategists, corporate trainers, creative leads, consultants, financial researchers, and startup teams can use this 36-slide deck to explain data, workflows, priorities, and business logic.
The deck includes target bullseyes, data tree networks, keyboard rockets, DNA allocation models, feature matrices, system loops, time metrics, question funnels, hexagonal crystals, world maps, stacked steps, flower process nodes, and a micro-icon pack.
Yes. The template works with Microsoft PowerPoint, Google Slides, and Apple Keynote, with 100% vector graphics, editable iconography, drag-and-drop placeholders, rapid color theme switching, and customizable slides, colors, fonts, and layouts.

Get full access to our entire collection of premium PPT templates for one simple price.
Forget about complex tools or technical skills—just choose, edit, and download.