 Get full access to premium PowerPoint templates at a limited-time price.Get Now
An annual financial report PowerPoint template helps finance teams turn a full year of financial results into a clear presentation for leadership, board members, investors, and internal stakeholders. Instead of sending spreadsheets alone, finance teams can use a structured deck to explain revenue performance, profit trends, cash flow, budget variance, risk areas, and the financial outlook for the next year.
This guide explains the key slides to include in an annual financial report presentation and how to organize financial data for business review meetings. If you want ready-made reporting layouts, explore PPTFOR’s Annual Report PowerPoint Templates and Business Report PowerPoint Templates.
An annual financial report PowerPoint template is a slide deck structure used to summarize a company’s financial performance over a full fiscal year. It usually includes revenue, expenses, profit, cash flow, balance sheet highlights, budget variance, financial KPIs, and next-year assumptions.
This template type gives CFOs, finance managers, FP&A teams, controllers, founders, and business consultants a more organized way to present financial results. The purpose is not to replace audited financial statements, but to make financial performance easier to review, discuss, and act on in business meetings.
Annual financial report presentations are commonly used by finance teams preparing year-end reviews, board updates, investor meetings, shareholder presentations, budget planning sessions, and internal leadership reviews. The audience usually wants more than numbers. They want to understand what changed, why it changed, and what the business should do next.
For finance teams, the biggest challenge is not collecting data. The challenge is choosing the right data, explaining variance, and connecting financial performance with business strategy. A good presentation template helps finance teams move from spreadsheet detail to board-ready reporting.
An annual financial report template often refers to a formal document, spreadsheet, or report file used to record financial results. An annual financial report PowerPoint template is different because it turns those results into a presentation for executives, board members, investors, and internal stakeholders.
Finance teams usually need both: detailed financial statements for accuracy, and a presentation deck for discussion. The PowerPoint version should summarize the numbers, explain major changes, and support faster business decisions during finance reviews, board meetings, and planning sessions.
A strong annual financial report PowerPoint should follow a clear financial narrative. These are the most useful slides to include:
The executive summary should give decision-makers the financial story before they review the detailed slides. Include the most important results from the year: revenue growth, margin movement, profit performance, cash position, and any major budget variance.
This slide should be short and selective. Finance leaders should avoid turning the summary into a full data table. The best version gives executives a clear answer to three questions: How did the business perform, what changed, and what needs attention?
The revenue section should show how the company generated income during the year. Depending on the business model, this may include revenue by product line, customer segment, geography, subscription plan, sales channel, or business unit.
Use this slide to explain growth drivers, not just totals. For example, if revenue increased, show whether the growth came from new customers, expansion revenue, higher pricing, stronger retention, or a specific market segment.
The profit and loss slide should summarize the financial path from revenue to profit. Useful measures may include gross profit, gross margin, operating expenses, operating income, EBITDA, net income, and year-over-year change.
This slide is especially important for board and leadership audiences because it connects operating decisions with profitability. A clean P&L summary helps stakeholders understand whether the business is growing efficiently or simply increasing revenue while costs rise faster.
Budget variance is one of the most useful sections in an annual financial report. It shows where actual results differed from the plan and gives finance teams a chance to explain why. Common variance areas include revenue, payroll, marketing spend, operating expenses, software costs, travel, and capital expenditures.
A good variance slide should not only show favorable or unfavorable differences. It should also explain whether each variance was caused by timing, market changes, operating decisions, one-time events, or a change in business priorities.
Cash flow tells a different story from profit. A company can look profitable on paper while still facing cash pressure because of delayed collections, inventory investment, debt payments, or capital spending. This is why annual financial reports should include a dedicated cash flow slide.
Finance teams can use this slide to show operating cash flow, accounts receivable trends, accounts payable movement, working capital changes, and liquidity position. This gives leadership a clearer view of financial flexibility going into the next year.
The balance sheet section should summarize the company’s financial position at year-end. It may include assets, liabilities, equity, cash balance, debt, current ratio, and other liquidity or leverage indicators.
This slide is useful when the audience needs to understand financial stability, capital structure, or investment capacity. Keep the layout simple and focus on changes that matter most for business decisions.
A financial KPI dashboard gives stakeholders a compact view of business health. Depending on the company, useful KPIs may include revenue growth, gross margin, operating margin, EBITDA margin, cash runway, working capital ratio, debt-to-equity ratio, customer acquisition cost, or revenue per employee.
The best KPI slide does not overload the audience. Choose the metrics that connect directly to the year’s performance and the next year’s priorities. Finance teams should use this section to guide decisions, not display every available metric.
The final section should turn financial reporting into forward planning. Include key risks, planning assumptions, forecast scenarios, cost pressures, revenue expectations, and major financial decisions for the next year.
This section is especially useful for board meetings and leadership reviews because it connects historical performance with future action. A strong annual financial report should help stakeholders understand both what happened and what the finance team recommends next.
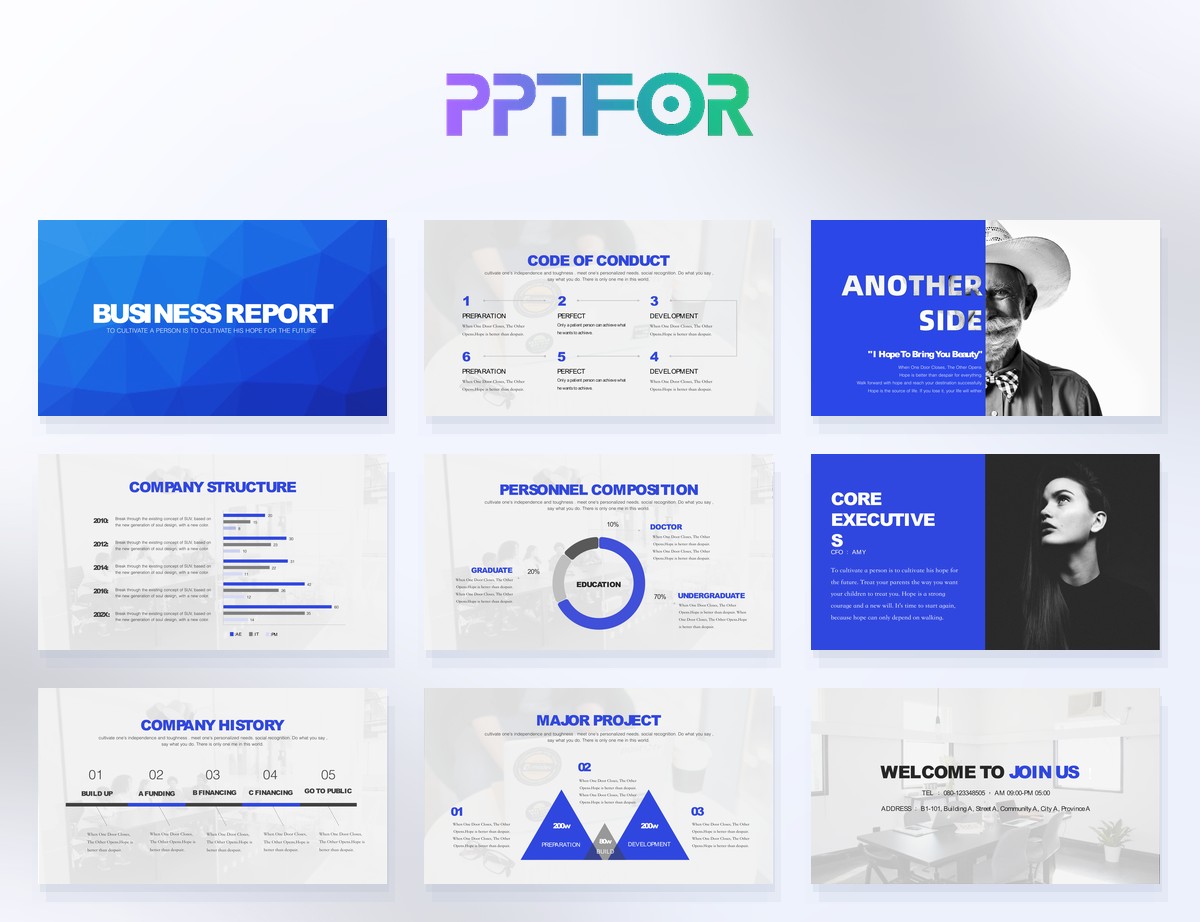
For an annual financial report, choose templates that support executive summaries, financial tables, KPI dashboards, variance analysis, cash flow summaries, and strategic recommendations. PPTFOR’s annual report PowerPoint templates are useful for year-end reporting, while business report PowerPoint templates can support broader leadership reviews and operating performance updates.
If the report is for a CFO, finance director, founder, board member, or investor audience, prioritize templates with structured report sections, readable chart layouts, and enough room for commentary. A financial report presentation should make the numbers easier to understand, not make the deck look busier.
One common mistake is copying spreadsheet tables directly into PowerPoint. Large tables may be accurate, but they are hard to read during a presentation. Use summary tables, callout numbers, simple charts, and short interpretation notes instead.
Another mistake is showing results without explaining drivers. If revenue grew, the audience needs to know why. If expenses increased, they need to know whether the increase was planned, temporary, or a risk. The best finance presentations connect numbers with business context.
Follow these steps to turn annual financial data into a clear presentation for finance and leadership review meetings.
An annual financial report PowerPoint template should include an executive summary, revenue performance, P&L overview, budget vs actual variance, cash flow, balance sheet highlights, financial KPIs, risk review, and next-year financial outlook.
CFOs, finance managers, FP&A teams, controllers, founders, consultants, and investor relations teams use annual financial report presentations for board updates, leadership reviews, investor meetings, and year-end planning discussions.
An annual financial report focuses mainly on financial performance, including revenue, profit, expenses, cash flow, and financial position. A business report may include broader operating topics such as strategy, marketing, sales, operations, projects, and team performance.
Yes. An annual report template can work well for finance reporting if it includes enough structure for financial summaries, KPI dashboards, charts, variance commentary, and next-year recommendations. Choose a layout that keeps financial data readable and decision-focused.

Get full access to our entire collection of premium PPT templates for one simple price.
Forget about complex tools or technical skills—just choose, edit, and download.